Download
1 / 51
540 likes | 806 Views
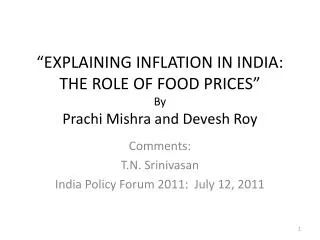
Explaining Inflation in India: The Role of Food Prices. Prachi Mishra (IMF) Devesh Roy (IFPRI). Presented by Prachi Mishra (Research Department, IMF). The views expressed here are those of the authors and do not necessarily represent those of the IMF/IFPRI or IMF/IFPRI policy.

E N D
Explaining Inflation in India: The Role of Food Prices Prachi Mishra (IMF) Devesh Roy (IFPRI) Presented by Prachi Mishra (Research Department, IMF) The views expressed here are those of the authors and do not necessarily represent those of the IMF/IFPRI or IMF/IFPRI policy.
Background/Motivation • High and rising inflation recognized as one of the biggest concerns facing emerging economies • High inflation not consistent with sustained growth (Fischer, 1993) • Inflation serves as “an indicator of the overall ability of the government to manage the economy” • Costs of inflation borne most heavily by the poor (Easterly and Fischer, 2001) • Among emerging economies, India stands out • Ranked among the “sizzling seven in terms of risks of overheating” (Economist, July 2, 2011)
Inflation a concern for Indian policy makers • “Inflation poses a serious threat to the growth momentum. Whatever be the cause, the fact remains that inflation is something which needs to be tackled with great urgency.” Manmohan Singh, February 4, 2011 • “…Not sure whether we understand all the factors that contribute to price rise” P. Chidambaram, Jan 6, 2011
Background/Motivation (contd.) • Need to investigate primary drivers – food/non-food/fuel • Knowing drivers at broad level not sufficient • Need to dig deeper into sources at disaggregated commodity level • Which sections of the population most affected? • Design carefully targeted policy measures • Focus on recent episodes not sufficient • Persistent upward trend
What we do/what we don’t • Forensic examination of the drivers of inflation • Focus on food price inflation • Use commodity-level and high frequency data on prices • Descriptive exercise • Focus not on measurement issues in inflation • Fuel excluded from analysis
Outline of the presentation • Data • How important is food in driving overall inflation? • Macro-econometric analysis of food vs non-food inflation • Which commodities drive food price inflation? • Simple decomposition of food price index • What factors drive food price inflation? • Case studies of specific commodities • Conclusions and policy implications
Data • Wholesale price index: Ministry of Commerce and Industry, Government of India • Period July 1988-May 2011 • Commodity-level data from April 1994 • Monthly frequency • Changing basket of commodities • Total 676 items; 112 food (2004-05=100; April 2004-May 2011) • Total 435 items; 95 food (1993-94=100;April 1994-March 2004) • Total 447 commodities; 79 food (1981-82=100;July 1988-April 1993) • Convert all the data (2005=100) • Inflation measured by year-on-year • Food inflation includes (i) primary and (ii) manufactured foods • Combined using Laspeyres formula, and respective weights
Decomposition approach based on Laspeyres Index Relative weight of commodity Inflation rate of commodity Ratio of commodity price to overall index in last period
Which commodities likely to be the biggest contributors to food inflation? • Commodities with high weights and high inflation rate are likely to be biggest contributors • Divide commodities into 4 bins: (i) high-inflation, high weight, (ii) high-inflation low weight, (iii) low-inflation, high weight and (iv) low-inflation, low-weights • High and low defined and below median
Case studies • Animal source foods: milk • Processed food: sugar • Cereals (wheat and rice) • Edible oils (vanaspati and mustard and rapeseed) • Fruits and vegetables (onions)
Explaining pattern of inflation: Long-term factors • Demand side factors • Changing structure of demand away from cereals towards high-value items • rising incomes, changing lifestyles, urbanization • Supply side factors • Changes in production and productivity • Long-term policies • Trade policies e.g. high trade barriers • Domestic policies e.g. system of support prices
Explaining pattern of inflation: Short-term factors • Short-term shocks • Negative shocks e.g. weather related • Positive shocks e.g. positive income shocks • Short-term policies • Domestic policy interventions e.g. revisions to minimum support prices • Trade policy responses e.g. export bans, liberalizing imports etc. • Movements in international prices • Long-term factors contribute towards building inherent inflationary pressures, increasing vulnerability to short-term shocks
Long-term factors • Sustained increases in production; rate of growth in production increased since 2005 (4.2% average 2005-2010) • Substantial increase in demand likely outpacing increase in production persistently • High income elasticity of demand (rising expenditure shares) • Gandhi and Zhou (2010) • High tariff barriers (68 percent in 2010)
Sugar (contd.) • Long-term factors • High income elasticity of demand (after animal source foods) • Difference from milk: there is no persistent demand-supply gap except in bad years (e.g. 2008-09) • Support prices sugarcane and for other competing crops • Domestic policy interventions on a regular basis e.g. putting a levy, regulating disbursements from mills, stocking limits, limit potential for growth • Tariffs on sugar of 60 percent, ban on imports of raw sugar • Short-term factors • inflation patterns closely related to production of sugar which follows sugarcane; • e.g.2008-09, production of sugarcane dropped, and inflation rate peaked in 2009 • Support prices were raised in 2008/09
05/09 – weak monsoon 04/11 – 60% import duty for raw and white sugar reinstated 08/10: Stocking limits relaxed to 90 days, exports of white sugar allowed 12/10: futures trading resumed
Conclusions • Use a high-frequency, commodity level dataset to provide a forensic account of drivers of inflation in India • Establish importance of food inflation • Typically higher than non-food, more volatile, persistent; U-shaped long-term trend, clear reversal since early 2000s; • long-run relationship with non-food, reveal significant pass-through • Top contributors of food inflation among the following commodities: milk, sugar, rice, wheat, fruits and vegetables, and edible oils • Case studies: both long-run and short-run important in explaining patterns of inflation
Policy implications • Focus on headline rather than core for policy purposes • Prices of specific commodities contain a wealth of information, which can be used to identify the most vulnerable groups, and design targeted policies • Given structural change in demand patterns, infrastructure and institutions specific to high-value items need to develop • Trade barriers remain; trade policy mainly used as a stop-gap tool to control inflation (exception is edible oils) • Effectiveness of trade policy as a shock absorber depends on timing and intensity • Takes time to build new trade relationships • International prices could change • Domestic policies: support prices need to indexed to inflation
Cereals • Not the top contributor to food inflation, still important to study • Government has been most proactive in in dealing with inflation • Cereal price rises can put pressure on prices of other food items through substitution away from non-cereals by producers • Strong producer support system • Rural wages linked to prices of cereals • pressure on other food items, through increasing costs of production
Cereals (contd.) • Long-term factors • Stagnant production, slow technology adoption • System of minimum support prices (MSP) • MSP acts as floor price, benchmark for inflation • Stockpiling by the government, not using reserves adequately • PDS (leakages and corruption) • Tariffs on rice and wheat at 70 and 50 percent. • Short-term factors • Drought in North India in 2009 (mainly affected rice) • Increase in MSP • Reinforces inflationary pressures; e.g. 2006, increase in MSP in wheat and increase in inflation • Ideally MSP should decrease in high inflation years and reduce in low-inflation years – no downward revisions ever • Other short-term policies • Restricting futures, banning exports, liberalizing imports
Onions (contd.) • Long-term factors • Shift in demand patterns • derived demand for onions from meat consumption • Supply side: off-farm constraints • Lack of cold storage, coordinated supply chains, etc. • Production and productivity increasing but low • Barriers to trade (exports are canalized) • Short-term factors • Weather shocks e.g. excessive rains in Maharashtra in end-2010 • Immediate response government • Ban on exports in Dec 2010 • Allowed imports of onions from Pakistan
Summary: Establishing the Importance of Food • Food inflation • Typically higher than non-food • more volatile • Quite persistent • Has a long run relationship with non-food inflation • Significant pass-through to non-food • Focus on headline rather than core measures (Catao and Chang, 2010, Anand and Prasad, 2010, Walsh, 2011)