Download
1 / 22
220 likes | 354 Views
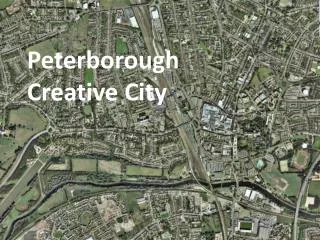
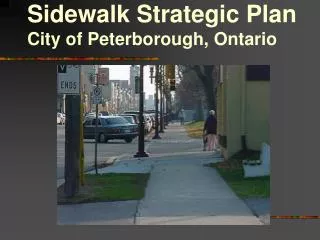
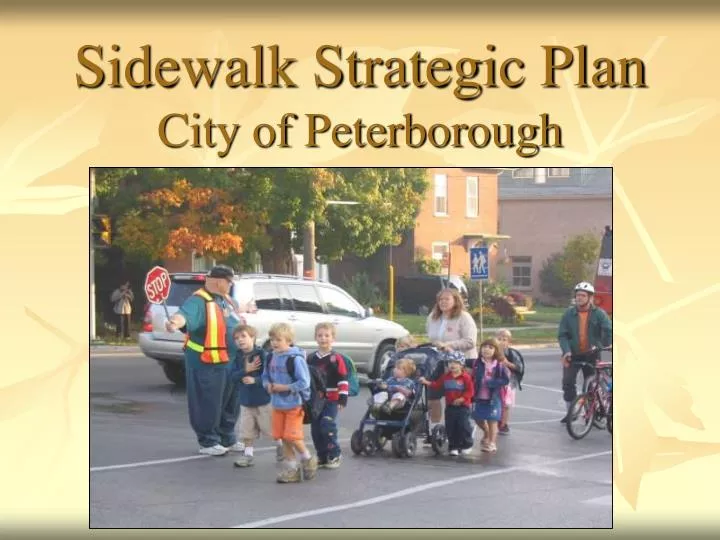
Sidewalk Strategic Plan City of Peterborough. About Peterborough. Pop. 75,000 Surrounding land is agricultural with Canadian Shield just to the north (cottages, canoeing) On Trent-Severn Waterway between Toronto (1.5 hr) and Ottawa (3 hr) University & college Hospital top employer.

E N D
About Peterborough • Pop. 75,000 • Surrounding land is agricultural with Canadian Shield just to the north (cottages, canoeing) • On Trent-Severn Waterway between Toronto (1.5 hr) and Ottawa (3 hr) • University & college • Hospital top employer
Walking & Cycling in Ptbo • Vibrant downtown, 38% work downtown • Suburbs just starting to spread
Walking & Cycling in Ptbo • 9% walk/bike to work • City only 8.5 x 5.5 miles wide (13.5 x 9 km)
Walking & Cycling in Ptbo • 36 km multi-use trails • 18 km cycling lanes (11 km new this year)
Why Develop aSidewalk Strategic Plan? • Walking targeted in Transportation Plan. Sidewalk key infrastructure to support walking. • Provides a reliable map and data for sidewalks – change can be measured over time • Set priorities for capital expenditures on sidewalks • Motivate Council to support sidewalk provision in new areas when they see costs of going back later • Provides opportunities to profile pedestrian needs, create an implementation plan, examine sidewalk policies
Our Process • Establish project Team and Terms of Reference • Develop criteria • Use GIS analysis to populate table – this included data capture for some criteria Pedestrian facilities absent less than 200 m from new recreation centre
Our Process • Evaluate results & revise criteria, several times • Consulted throughout this part of the process with local groups ASRTS & ASCR • Create map and Excel tables with results • Report to Council, including implementation of Priority 1 & 2 sidewalks and new sidewalk policy
GIS – Benefits & Limitations • Can rank and map limitless sidewalks • Criteria can be modified and data readily updated • Applying criteria can be tricky – need to choose between whether criteria applies when just touching or when it includes whole sidewalk segment • Need to know area fairly well to evaluate results for “nonsense”, not completely unbiased
Students Bused Within School Walking Zones – A Criteria that Changed Original Version Revised Version
Getting the Plan to Council • Senior mgt. uncomfortable with ambiguous expectations • Created implementation plan for Priority 1 & 2 sidewalks • Extended timeline from 10 to 14 years to keep budget status quo • Created new sidewalk policy – unplanned, but value-added
Plan Outcomes • Start to finish, 2 years • Approved March 2008 • Now have: • All sidewalks ranked and mapped • Implementation plan (14 years) for all Priority 1 & 2 sidewalks • New sidewalk policy – sidewalks provided on both sides of all streets
Priority Level No Sidewalks (metres) Percentage 1 5,078 1% 2 36,301 9% 3 179,675 46% 4 172,425 44% Total 393,479 100% Sidewalk Stats in 2008
Implementation Strategy • Implement all Priority 1 (5,078 m) and Priority 2 (36,301 m) sidewalks over 14 years • Annual cost of $475,000/yr, $100,000 as part of road reconstr. projects • Total cost in 2007 dollars of $6.6 million
Day to Day Use Sidewalk Map with priorities identified is used by staff as a regular reference point e.g. calls from public about sidewalk – everyone comes to look at the map to see what priority it is
Implementation – Year 1 • Debate about Middlefield sidewalk • Public Works lobbying for $’s to be spent on maintenance • Commitment sketchy even though just approved The Great Save!?! (No, we didn’t tip… this time)
What Now? • Public meeting • Develop a communication plan for community notification of sidewalks planned for the coming year • Phase 2 – Curb cuts at intersections to be prioritized • Update Plan every 3 years • Update mapping database when new sidewalks constructed
More Initiatives to Come George Street Today • Keep an eye on the new sidewalk policy & its effectiveness • Expand policy to broader “Complete Streets” policy when Transportation Plan reviewed in 2009 • Improve sidewalk maintenance standards • Intersection design – actuated signals, crossing distances, etc. Got your skates? Tomorrow?