Download
1 / 10
100 likes | 184 Views
Space-based Estimates of Anthropogenic SO 2 Emissions. Randall Martin, Dalhousie and Harvard-Smithsonian Chulkyu Lee, Dalhousie U National Institute of Meteorological Research, Korea with contributions from Aaron van Donkelaar, Dalhousie University Russell Dickerson, UMBC

E N D
Space-based Estimates of Anthropogenic SO2 Emissions Randall Martin, Dalhousie and Harvard-Smithsonian Chulkyu Lee, Dalhousie U National Institute of Meteorological Research, Korea with contributions from Aaron van Donkelaar, Dalhousie University Russell Dickerson, UMBC Jennifer Hains, Dept of Environment, Maryland Nick Krotkov NASA Goddard Andreas Richter, U Bremen 5th International GEOS–Chem Meeting 3 May 2011
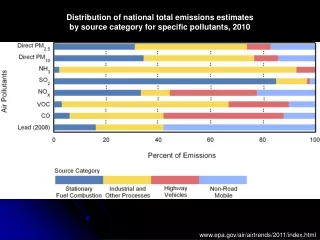
SO2 Emissions Have Major Implications for Climate, Air Quality, and Acid Deposition
Information about Anthropogenic SO2 Sources?First Need to Improve SO2 Retrieval Algorithm Lee et al., JGR, 2009
Local Air Mass Factor Improves Agreement with Aircraft Observations (INTEX-A and B) OMI SCIAMACHY Orig: slope = 1.6, r2 = 0.50 New: slope = 0.95, r2 = 0.85 Orig: slope = 1.3, r2 = 0.62 New: slope = 1.1, r2 = 0.79 Uses LIDORT from Spurr et al. Lee et al., JGR, 2009
Anthropogenic Sources Dominate Annual Mean SO2 Column Volcanic SO2 Emissions 10% of Anthropogenic Source GEOS-ChemSimulations for 2006 Total SO2 Column Anthropogenic SO2 Column Fraction from Anthropogenic Lee et al., JGR, 2011
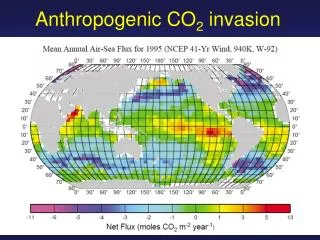
Use OMI and SCIAMACHY SO2 Columns to Map SO2 Emissions Tropospheric SO2 column ~ ESO2 Over Land day OH, cloud SO42- DMS SO2 ~day Deposition Emission Phytoplankton Combustion, Smelters, Volcanoes
Evaluate GEOS-Chem SO2 Lifetime vs Calculations from In Situ Measurements U Maryland Research Flights for Eastern U.S. C is SO2 from EPA Network H is GEOS-4 Mixed Layer Depth June - August Hains, Dickerson, et al., 2007 Lee et al., JGR, 2011
Global Anthropogenic Sulfur Emissions Over Land for 2006Volcanic SO2 Columns (>1x10¹⁷molec cm-2) Excluded From Inversion Top-Down (OMI) 49.9 Tg S/yr Bottom-Up in GEOS-Chem (EDGAR2000, NEI2005, EMEP2005, Streets2006) Scaled to 2006 r2 = 0.59 54.6 Tg S/yr SO2 Emissions (1011 molecules cm-2 s-1) Lee et al., JGR, 2011 Cloud Radiance Fraction < 0.2
Anthropogenic Emissions Differences (2006) -2.2 Tg S/yr -4.7 Tg S/yr Cloud Radiance Fraction < 0.2, SZA < 50o Lee et al., JGR, 2011
Emerging Capability for Top-down Constraints on Anthropogenic SO2 Emissions • Similar top-down inventories from different retrievals • Close agreement with bottom-up over North America and Europe • Challenges • Further development of SO2 retrievals • Evaluate and improve simulation of sulfur chemistry • Apply more sophisticated inversion capability Acknowledgements: Health Canada, NASA