Download
1 / 80
871 likes | 1.7k Views
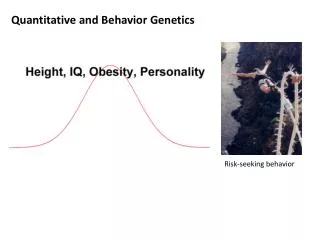
Quantitative Genetics. “Qualitative” traits: Blood groups (ABO) Coat color in cats Color vision Difference between phenotypes of two individuals can be explained by difference in genotype at a small number of loci (for example, 1 or 2). Mendelian ratios in F 1. Quantitative traits:

E N D
“Qualitative” traits: Blood groups (ABO) Coat color in cats Color vision Difference between phenotypes of two individuals can be explained by difference in genotype at a small number of loci (for example, 1 or 2). Mendelian ratios in F1 Quantitative traits: Height Weight Facial features The phenotype is determined – to some extent – by genotype, but phenotypic difference between individuals is due to difference in genotype at a large number of loci. No Mendelian ratios in F1 A loose distinction
Gene for starting businesses “If you belong to a certain extended family in Seattle, you're probably an entrepreneur. It seems to be about the only career many of the members ever considered. ''It's in our blood'' said Brian Jacobsen, president of Madison Park Greetings, a stationery and gifts company. Mr. Jacobsen's brother, mother, grandfather, two uncles, two cousins and an aunt all started and ran their own companies and say they cannot imagine any other livelihood. Why are so many people in the same clan hooked? Some of them have a theory. They believe that somewhere in their chromosomes lurks an actual entrepreneurial gene -- that their bent for business really is in their blood.” New York Times, Nov. 20, 2003 – p. C8
New York Times, Nov. 20, 2003 – p. C8
Gene for metaphors “AG: Many of your songs include clear, visual images. Do these images come from dreams? Suzanne Vega: My mind works in a metaphorical way. It’s easier for me to say what I see than what I feel. The emotions are expressed in the images. I think it must be genetic, because my daughter, Ruby, thinks the same way. She’ll see smoke coming out of the back end of a car and say, "The smoke is tap-dancing." And if you look at it, you can see what she means. http://www.acousticguitar.com/issues/ag110/feature110.html
The God Gene “Modern science is turning up a possible reason why the religious right is flourishing and secular liberals aren’t: instinct. It turns out that our DNA may predispose humans towards religious faith. … Dean Hamer, a prominent American geneticist, even identifies a particular gene, VMAT2, that he says may be involved. People with one variant of this gene tend to be more spiritual, he found.” N. Kristof, New York Times, 2-12-05
“Nature vs. nurture”:the curse of “folk wisdom” Is a given human trait in a given person the result of “genes or the environment”? • “She got her brains from her Dad” • “Crime runs in his family – it’s genetic…” • “All Klingons are bellicose” (“Blood tells”) • “… is genetically predisposed to …”
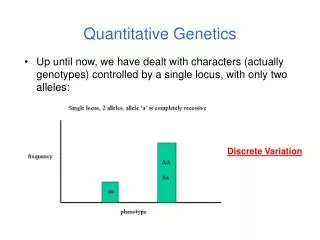
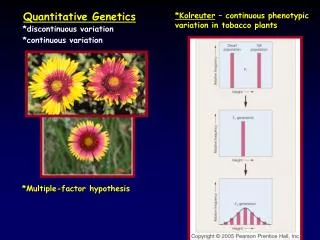
In a population, phenotypes of individuals for a quantitative trait tend to be normally distributed
Central limit theorem Carl Friedrich Gauss If a variable is the sum of many independent variables, then its distribution will be normal:
In this example, a trait (color) is controlled by three loci, A, B, and C, each of which occurs in only 2 alleles. The actions of the alleles is somewhat additive, in other words, an aabbcc organism is all white, whereas an AABBCC organism is dark red. The remarkable thing is, even with such a simple system (three loci with two alleles each!), we can get a remarkably “smooth” distribution of phenotypes!
Crisper distinction between Mendelian and quantitative traits: For a quantitative trait, the range of phenotypes exhibited by individuals in any given genotypic class is BROADER than the difference between two average individuals of two different genotypes. In contrast, for a Mendelian trait, two individuals of the same genotype will tend to be relatively similar, and all quite strikingly distinct from individuals of a different genotypic class.
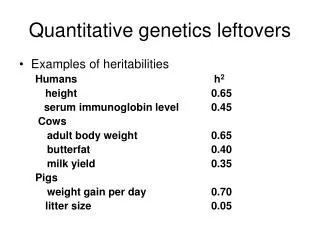
Is trait X heritable? Height – yes. Language – no. Neuroticism – ?
Pellagra Disorder caused in large part by ???, and characterized by skin lesions and by gastrointestinal and neurological disturbances--the so-called classical three Ds of pellagra: dermatitis, diarrhea, and dementia. Pellagra Commission (1910s): simple Mendelian inheritance of pellagra in the US South. “Controversy over the origins of pellagra continued until the mid-1930's…” Pellagra is caused by a dietary deficiency of niacin (nicotinamide and nicotinic acid) – precursor to NAD and NADP Pellagra ran in families because poverty ran in families, and poor families in the South subsisted on corn, which is low in niacin.
Is a trait heritable? Well, let’s mate individuals from the two extremes of the distribution, place their progeny into a common, controlled environment, and look. If the progeny follow a distribution that is skewed from the parental one towards the end of the curve their parents came from, the trait is heritable. If the progeny follow the same distribution as the original one, the trait is not heritable.
Mapping of quantitative trait loci (QTLs) “Search for genes responsible for variance in quantitative traits”
Ulrike Heberlein: the inebriometer Moore et al. (1998) Cell 93: 997.
QTL mapping, version 1 Testing alleles of candidate genes (forward genetics): pick a gene (serotonin receptor) that may have something to do with the trait under study (neuroticism) and look for allelic forms thereof that may occur more frequently in individuals who are neurotic. How do you measure someone’s level of neuroticism? http://cac.psu.edu/~j5j/test/ipipneo1.htm
“Mood disorders”: anxiety • Serotonin (5-HT) – neurotransmitter (motor activity, food intake, sleep, reproductive activity, cognition, emotional states, including mood and anxiety). • Serotonin transporter (5-HT uptake) – two alleles (long and short) – former transcribed more efficiently • “NEO personality inventory” – people with short allele have greater anxiety-related personality characteristics • Polymorphism explains 7-9% of genetic variance Lesch et al. (1996) Science 274: 1527.
“Serotonin transporter genetic variation and the response of the human amygdala” “Individuals with one or two copies of the short allele of the serotonin transporter (5-HTT) promoter polymorphism, which has been associated with reduced 5-HTT expression and function and increased fear and anxiety-related behaviors, exhibit greater amygdala neuronal activity, as assessed by BOLD functional magnetic resonance imaging, in response to fearful stimuli compared with individuals homozygous for the long allele. These results demonstrate genetically driven variation in the response of brain regions underlying human emotional behavior and suggest that differential excitability of the amygdala to emotional stimuli may contribute to the increased fear and anxietytypically associated with the short SLC6A4 allele.” Hariri et al (2002) Science 297: 400.
Living With Our GenesD. Hamer and P. Copeland (1998) “In the future, a person who complains of depression or anxiety could have a DNA test to check the serotonin genes. People with compulsive behaviour such as gambling, drinking, drugs, or promiscuous sex, would be checked for dopamine genes. Eating disorder or obesity? Look at the genes for leptin, the leptin receptor, or its targets. … Doctors won’t be the only ones to read this information. Insurance companies … would be very interested in genetic predispositions toward addiction or mental disorders. The military … might want to know about genes for rebellious temperament. Employers might be interested in genes for loyalty. Religious orders would be wise to discourage high novelty seekers, while the maker of sports cars would want to target them with ads. Dating services would have revealing new ways to match people. Imagine how excited certain school administrators would be to track students who are bright, troubled, or aggressive.”
QTL mapping, version 2 Mapping by linkage: Take pedigrees with some frequency of individuals affected by a trait (e.g., schizophrenia), and scan their entire genome for “linkage” with some polymorphic marker (e.g., a RFLP).
Well-said “The fact that single genes can be modified and produce obese mice conclusively shows that genes contribute to obesity. However, the effect of a tested gene – especially if it contributes to complex traits – depends on the genetic background (i.e., the effects of other genes – and thus might or might not produce the expected phenotype, or a milder phenotype.” Brockmann and Bevova (2002). Trends Genet. 18: 367.
Problem For “simple” traits, the genotype-phenotype relationship is fairly unambigious, issues of penetrance and expressivity aside. If you are homozygous for HbS, you will get SCA, no question about it. It is largely irrelevant, what environment you grow up in – you’ll get anemia (although medical care will help you lead a better life, no question about that). For qualitative traits, the relationship between genotype and phenotype is impossible to express in a simple statement, so the general public, eager for simple solutions that fit its short attention span, has become enamored of the word “tendency.”
Sigh “Genetic predisposition to…”: (you name it)
A pernicious line of reasoning I did X (or “I am Y”) I have a gene that caused me to do X (or to become Y) It’s not my fault, it’s the gene’s fault (or, “I am genetically superior”)
Misunderstanding a fundamental distinction between quantitative and qualitative traits Let’s say a driver with colorblindness (a mutation on the X chromosome) ran a streetlight and killed a person. Well, on some level, we will be less prone to blame that person (“he can’t help being colorblind”) for that act than someone with normal color vision who got drunk and ran that light. The leap here is to go from such “assignment of blame” in the case of qualitative traits, with their fairly unambiguous genotypephenotype relationship, to similar logic for quantitative traits (“I ran the streetlight because I was scared of being late to work, and I carry the allele of the serotonin receptor gene that makes me genetically scared”).
Norm of reaction A plot of carefully measured phenotype in large pool of genetically identical individuals grown under a range of environments.
Take 7 yarrow plants, grow cuttings from each one at different elevations. Measure each “child” at each elevation.
Risk of breast cancer and physical exercise in BRCA1/2 mutation carriers: an example of how the norm of reaction illuminates the modification of a “genetic tendency” by environment “Physical exercise and lack of obesity in adolescence were associated with significantly delayed breast cancer onset.” M.-C. King et al. Science 2003
The reality of “Nature vs. nurture”: a group of individual of identical genotype, when placed in a normally distributed range of environments (X axis) will yield a population with a normally distributed range of phenotypes (Y axis), but the shape of the distribution will be a function BOTH of that genotype’s norm of reaction and of the distribution of environments.
Nature vs. Nurture: Wrong Question! • Each organism is the subject of continuous development throughout its life. The environment’s effects on the organism will vary depending on when in development the effect is exerted (e.g., PKU). • The developing organism is not under the effect of genes and the environment acting separately. It is under the effect of mutually interacting genes and the environment. In the resulting organism, the effects of nature and nurture are as “separable” as effects of flour and of the oven in the baked muffin.
And therefore … For any given individual, assigning percentages to “genes” and “environment” in determining the phenotype for a given quantitative trait has no meaning. For each given quantitative trait, each human being (a specific, given genotype), has a norm of reaction. The “norm of reaction” describes exactly how the trait will develop when very many individuals of exactly identical genotype will be placed in many different, very carefully controlled environments. Careful analysis of the norm of reaction may, perhaps, tell us a little bit about how the genes responsible for that quantitative trait interact with the environment in that trait’s development. No percentage values will be assigned to “nature or nurture” at any point in time—they are meaningless in this context.
“The Bell Curve” (1994)R.J. Herrnstein and C. Murray Claims (according to HnM, based on data they present): • African-American and Latinos in the US score on the average lower on IQ tests that whites or Asian-Americans, and lower IQ contributes to greater crime, poverty, illegitimacy, welfare dependency, unemployment, workplace injury. • IQ is substantially heritable and the higher fecundity of Blacks and Latinos leads to dysgenesis – a decline in the population’s potential for high IQ. • Forecast: establishment of a caste-like, reproductively isolated, cognitive elite, maintained through intermarriage, and ruling over the cognitively limited masses.
Public vs. private dialogue HM: “Here was a case of stumbling onto a subject that had all the allure of the forbidden. Some of the things we read to do this work, we literally had to hide when we were on planes and trains.” In other words, the data really support all the claims, and people are afraid to admit it. Problem: >99% of all people in the US are not qualified to understand whether the data support the claims. New York Times: “But this reviewer is not a biologist and will leave the arguments to the experts” (10/27/94).
Calling a spade a spade “[The] taboo being violated is … that of the great war against Nazi Germany. It’s not the taboo against unflinching scientific inquiry, but against pseudoscientific racism. Of all the world’s taboos, it is the one most deserving of retention.” John Judis Hearts of Darkness (The Bell Curve Wars, New York, Basic Books 1995)
For the record • In my opinion, Drs. Herrnstein and Murray are pseudoscientific racists. That is, they just don’t like people of other races, and hide that dislike behind data, or what they claim to be data. • In addition, they deliberately misinterpret those data, and their conclusions, therefore, are wrong. • Problem: while no education is necessary to see the validity of item 1, item 2 requires a large amount of specialized knowledge.
What do the data show? What is IQ and how heritable is it? How severe is the threat of dysgenesis for IQ? What is the correlation between low IQ and societal ills? To answer these question, we must examine the scientific meanings of the words “IQ” and “heritable,” the procedures for measuring IQ heritability in human populations, or the heritability of anything in any population, and how correlations between things are actually measured.
Point 1 – the reification of IQ “Among the experts, it is by now beyond much technical dispute that there is such a thing as a general factor of cognitive ability on which human beings differ and that this general factor is measured reasonably well by a variety of standardized tests, best of all by IQ tests designed for the purpose” H+M “Extraordinary obfuscation” (SJG, The Mismeasure of Man)
“The tendency has always been strong to believe that whatever received a name must be an entity or a being, having an independent existence of its own. And if no real entity answering to the name could be found, men did not for that reason suppose that none existed, but imagined that it was something peculiarly abstruse and mysterious.” John Stuart Mill
Speed Rodgers Rop (Kenya) 2 hrs. 9 min. marathon Tim Montgomery (USA) 9.78 sec. 100 m Nolan Ryan (USA) 100.9 mph 8/20/74