Download
1 / 32
320 likes | 432 Views
Global & Regional Climate Change Science a presentation from the CIMSS Climate Literacy Ambassadors community A low-carbon climate education project. Differences between Weather & Climate. “Climate is what you expect, weather is what you get”.

E N D
Global & Regional Climate Change Sciencea presentation from the CIMSS Climate Literacy Ambassadors community A low-carbon climate education project
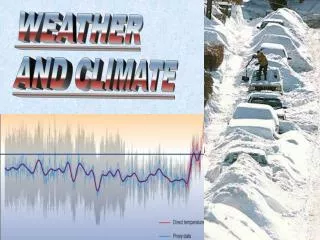
Differences between Weather & Climate “Climate is what you expect, weather is what you get” Weather is the condition of the atmosphere at a particular location and moment. Each day current weather conditions are given in local weather reports. Climateis the collective state of the atmosphere for a given place over a specified interval of time. There are three parts to this definition …
Climate is the collective state of the atmosphere for a given place over a specified interval of time. There are three parts to this definition: • Location because climate can be defined for a globe, a continent, a region, or a city. • 2. Time because climate must be defined over a specified interval. NOAA typically uses 30-year averages, whereas studying Earth’s history often involves averages of a century or longer. • 3. Averages and extremes of variables such as temperature, precipitation, pressure & winds.
Global Climate Change Global Temperature: Has increased by ~0.7°C over the last 100yr. The rate of increase is “accelerating”. Global data & graphs in this presentation are from 2007 IPCC report
Rising atmospheric temperature Rising sea level Reductions in NH snow cover Warming is Unequivocal Also, the Oceans are warming & becoming more acidic
A different world in the Arctic: present and future Significant decreases in Arctic sea ice extent. Changes in sea ice don’t significantly affect sea level because this ice is already floating. Melting land ice (glaciers, ice caps, and ice sheets) increases sea level.
Figure SPM.1 10,000 5,000 0 Years before 2005
Industrial revolution and the atmosphere The current concentrations of key greenhouse gases, and their rates of change, are unprecedented. Carbon dioxide Methane Nitrous Oxide Intergovernmental Panel on Climate Change 2007
The climate system is more complex than just CO2 and radiationWhat about the feedbacks?
One way to think about Climate Change is an intensification of the water cycle As the temperature of the atmosphere rises, more water is evaporated from ground storage (rivers, oceans, reservoirs, soil). Because the air is warmer, the relative humidity can be higher, and the atmosphere can 'hold' more water vapor. As a greenhouse gas, the higher concentration of water vapor is then able to absorb more thermal IR energy radiated from the Earth, thus further warming the atmosphere. The warmer atmosphere can then hold more water vapor and so on and so on. This is referred to as a 'positive feedback loop'. In a warming climate, water vapor plays a major role in a positive feedback loop that amplifies global climate change. (H20responds to changes in climate, but it doesn’t drive climate change)
Observed warming is consistent with observed changes: There is a widespread retreat of nonpolar glaciers. Arctic sea-ice has thinned by 40% in recent decades (summer & autumn) And decreased in extent by 15% since the 1950s in spring and summer. Northern Hemisphere snow cover has decreased by 10% since the 1960s. The growing season has lengthened by about 1 to 4 days per decade during the last 40 years in the Northern Hemisphere, especially at higher latitudes. The duration of ice cover on lakes decreased by about 2 weeks over the 20th century in mid- and high latitudes of the Northern Hemisphere. The global mean sea level has increased at an average annual rate of 1 to 2 mm during the 20th century.
Are Humans Responsible? Natural and human effects Natural forcings only Pinatubo Agung Chichon IPCC (1995): “Balance of evidence suggests discernible human influence” IPCC (2001): “Most of global warming of past 50 years likely (odds 2 out of 3) due to human activities” IPCC (2007): “Most of global warming of past 50 years very likely (odds 9 out of 10) due to greenhouse gases” Observations IPCC WG1 - 2007 (Intergovernmental Panel on Climate Change)
Regional Climate Change Featuring information from two recent reports: Global Climate Change Impacts in the United States - 2009 – U.S. Global Change Research Program Midwest Region Wisconsin’s Changing Climate: Impacts and Adaptation - 2011 - Wisconsin Initiative on Climate Change Impacts (WICCI) http://www.wicci.wisc.edu/
Great Lakes Key Issues During the summer, public health & quality of life, especially in cities, will be negatively affected by increasing heat waves, reduced air quality, and increasing insect and waterborne diseases. The likely increase in precipitation in winter and spring, more heavy downpours, and greater evaporation in summer would lead to more periods of both floods and water deficits. Reductions in Great Lakes water levels will have impacts on shipping, infrastructure, beaches, & ecosystems. Native species are very likely to face increasing threats from rapidly changing climate conditions, pests, diseases, and invasive species. While the longer growing season provides the potential for increased crop yields, increases in heat waves, floods, droughts, insects, and weeds will present increasing challenges to managing crops, livestock, and forests.
FLOODING Observed Increases in the average number of days with very heavy precipitation 1958 to 2007 2008 Lake Delton Dam failure due to heavy rains From 1950 to 2006, Wisconsin as a whole became wetter, with a 10 percent increase in annual precipitation (3.1 inches)
Climate Change in Wisconsin What does the historical record tell us? Climate change in Wisconsin: 1950-2006 Wisconsin isn’t necessarily getting hotter, but rather less cold. http://www.wicci.wisc.edu/
Climate Change in Wisconsin What does the historical record tell us? Changes in Daily Maximum Temperature: Summer Tmax Fall Tmax Winter Tmax Spring Tmax The Greatest Amount of Warming is Occurring in Winter and Spring Kucharik and Serbin, in prep
Climate Change in Wisconsin What does the historical record tell us? Changes in Daily Minimum Temperature: Winter Tmin Spring Tmin Summer Tmin Fall Tmin Nighttime low temperatures are warming faster than daytime highs Kucharik and Serbin, in prep
Learn more from CLIMATE WISCONSIN www.climatewisconsin.org
Models Project Continued Warming UW-Madison researchers used “down-scaled” climate models to project that Wisconsin’s warming trend will continue and increase considerably in the decades ahead. By the middle of the century, statewide annual average temperatures are likely to warm by 6-7 degrees Fahrenheit.
Slowing Change & Minimizing Impacts Mitigation: reduces amount of global warming Adaptation: reduces the impact Mitigation: Necessary to avoid dangerous climate change Adaptation: Climate change is happening; Adaptation needed to minimize impacts
Guiding Principle: Humans can take actions to reduce climate change and its impacts Many actions have co-benefits
Co-Benefits of Carbon Mitigation • By using less energy, you can reduce carbon emissions andsave money • By walking or riding a bike to work a few days a week you can improve your health andsave money 3) Did we mention saving money ???
Co-Benefits of Driving Less: Clean Air Along with saving money on gas …. Can you commit to car pooling, walking or riding to work one day a week? (or two or three?)
Co-Benefits of Driving Less: Health Along with saving money on gas ….
Learn More On-Line • Developed collaboratively • by four UW departments • (CIMSS, AOS, Geology, CCR) • Consistent with Climate • Literacy Framework • Clarifies IPCC report • Beta version debuted 2008 • NASA 2010 GCCE support • for updates, revisions & • stipends for G6-12 teachers • Credit OR Certificate http://cimss.ssec.wisc.edu/climatechange/ Steve.Ackerman@ssec.wisc.edu Margaret.Mooney@ssec.wisc.edu
The Climate Literacy Ambassadors program was developed to raise awareness of climate science and lay the foundation for the guiding principle of the Climate Literacy: Humans can take actions to reduce climate change and its impacts