Download
1 / 1
10 likes | 134 Views
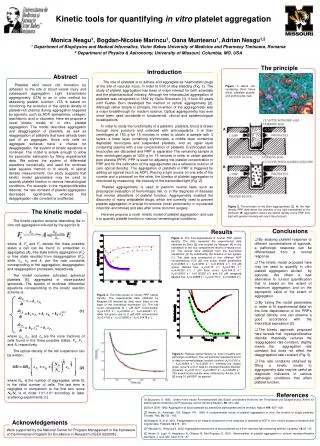
Kinetic tools for quantifying in vitro platelet aggregation. Monica Neagu 1 , Bogdan-Nicolae Marincu 1 , Oana Munteanu 1 , Adrian Neagu 1,2 1 Department of Biophysics and Medical Informatics, Victor Babes University of Medicine and Pharmacy Timisoara, Romania

E N D
Kinetic tools for quantifying in vitro platelet aggregation Monica Neagu1, Bogdan-Nicolae Marincu1, Oana Munteanu1, Adrian Neagu1,2 1 Department of Biophysics and Medical Informatics, Victor Babes University of Medicine and Pharmacy Timisoara, Romania 2 Department of Physics & Astronomy, University of Missouri, Columbia, MO, USA The principle Introduction Abstract The role of platelets is to adhere and aggregate as haemostatic plugs at the site of vascular injury, in order to limit or stop bleeding (Fig. 1). The study of platelet aggregation has been of major interest for both scientists and the pharmaceutical industry. Although the intravascular aggregation of platelets was recognized in 1882 by Giulio Bizzozero [1], it took 80 years until Gustav Born developed the method of optical aggregomerty [2]. Although rather simple in principle, the invention of the aggregometer was a major breakthrough for modern science. Optical aggregometry has ever since been used worldwide in fundamental, clinical and epidemiological investigations. In order to study the functionality of a patient’s platelets, blood is drawn through vene puncture and collected with anticoagulants. It is then centrifuged at 150 g for 15 minutes in order to obtain a sample with 3 layers: a lower layer containing erythrocytes, a middle layer containing deposited leucocytes and suspended platelets, and an upper layer containing plasma with a low concentration of platelets. Erythrocytes and leucocytes are discarded and PRP is separated The remaining sample is then centrifuged again at 1200 g for 15 minutes in order to obtain platelet poor plasma (PPP). PPP is used for adjusting the platelet concentration in PRP and for the calibration of the aggregometer (as a reference solution of zero optical density). The aggregation of platelets in PRP is triggered by adding an agonist (such as ADP). Placing a light source on one side of the cuvette and a photocell on the other, the kinetics of platelet aggregation is monitored by measuring the intensity of the transmitted light (Fig. 2). Platelet aggregometry is used to perform routine tests such as presurgical evaluation of hemorrhagic risk, or in the diagnosis of diseases that involve alterations of platelet function. Aggregometry enabled the discovery of many antiplatelet drugs, which are currently used to prevent platelet aggregation in arterial thrombosis (most prominently in myocardial infarction and stroke) and also after some common surgery. Here we propose a novel kinetic model of platelet aggregation and use it to quantify platelet function in various hematological conditions. Platelets elicit blood clot formation by adhesion to the site of blood vessel injury and subsequent aggregation. Light transmission aggregometry (LTA) is an in vitro method for assessing platelet function. LTA is based on monitoring the evolution of the optical density of platelet-rich plasma during aggregation triggered by agonists, such as ADP, epinephrine, collagen, arachidonic acid or ristocetin. Here we propose a novel kinetic model of in vitro platelet aggregation. The model describes aggregation and deaggregation of platelets, as well as reaggregation of platelets that have already been part of an aggregate. Since only cells on aggregate surfaces have a chance for deaggregation, the system of kinetic equations is nonlinear. The model is simple enough to allow for parameter estimation by fitting experimental data. We solved the system of differential equations numerically, and used the nonlinear least squares method to fit results of optical density measurements. Our study suggests that kinetic model parameters may be used to quantify platelet function in various hematological conditions. For example, in the myeloproliferative disorder, the rate constant of platelet aggregation decreases significantly, whereas the deaggregation rate constant is unaffected. Figure 1. Blood clot containing fibrin fibers (blue), platelets (purple) and erythrocytes (red). A B Figure 2. The principle of the Born aggregometer [2]. A: the high density PRP diminishes the intensity of the light transmitted to the photocell. B: aggregation lowers the optical density of the PRP, thus light with greater intensity will reach the photocell. The kinetic model The kinetic reaction scheme describing the in vitro cell aggregation induced by the agonist is: where A, Fo and F1 denote the three possible states a cell can be found in: embedded in aggregates (A), free state before aggregation (Fo) or free state resulted from deaggregation (F1), while ka, kd and kr are the rate constants corresponding to the aggregation, deaggregation and reaggregation processes, respectively. The model considers activated, spherical platelets [5], aggregated in close-packed spheroids. The system of nonlinear differential equations corresponding to the kinetic reaction scheme is: (1) where cFo, cF1 and cAare the mole fractions of cells found in the three possible states, Fo, F1 , and A, respectively. The optical density of the cell suspension can be written: (2) where NN is the number of aggregates, while No is the initial number of cells. The last term is negligible in comparison to the first two, since NN/No is of order 10-3–10-4 according to laser scattering experiments [5]. Conclusions Results Figure 3. The time-dependence of human PRP optical density. The dots represent the experimental data obtained by Born [2] and studied by Maayani [4] in the framework of the four compartment model of Hause et al. [3]. The curves were obtained from the theoretical expression (2) by substituting the solution of the system (1). The data sets correspond to four different ADP concentrations: 0.25 μM (red curve, model parameters ka=0.00823 s-1, kd=0.0256 s-1, kr=0.00322 s-1),0.5 μM (green dashed line, ka=0.0115 s-1, kd=0.0160 s-1, kr=0.00322 s-1), 1 μM (blue curve, ka=0.00412 s-1, kd=0.00930 s-1, kr=0.00322 s-1) and 2.5 μM (magenta dashed line, ka=0.00689 s-1, kd=0.0176 s-1, kr=0.00826 s-1). • By studying platelet response to different concentrations of agonists, a pathologic response can be differentiated from a normal response. • The kinetic model proposed here may be used to quantify in vitro platelet aggregation elicited by agonists; this offers a new alternative to current quantification that is based on the extent of maximum aggregation and on the asymptotic value of the extent of aggregation. • By tuning the model parameters in order to fit experimental data on the time dependence of the PRP’s optical density,one can observe a good accordance with the theoretical expression (2). • The kinetic approach proposed here reveals that myeloproliferative disorder drastically reduces the reaggregation rate constant, slightly lowers the aggregation rate constant, but does not affect the deaggregation rate constant (Fig. 5). • The rate constants obtained by fitting a kinetic model to aggregometry data may be useful as diagnostic indicators in various pathologic conditions that affect platelet function. Figure 4. The time-course of human PRP optical density. The experimental data obtained by Maayani [4] (marked by dots) were fitted on the base of the theoretical expression (2). The red curve corresponds to 1 μM ADP concentration (ka=0.0137 s-1, kd=0.0206 s-1, kr=0.000027 s-1),while the green one to 2 μM ADP concentration (ka=0.0106 s-1, kd=0.00866 s-1, kr=0.00478 s-1). Figure 5. Relative optical density vs. time in healthy and pathologic conditions. The red solid line represents the fit of data on normal platelet function (circles) (ka=0.0162 s-1, kd=0.00564 s-1, kr=0.0293 s-1), whereas the dotted green curve is a fit of data on myeloproliferative disorder (squares) (ka=0.0110 s-1, kd=0.00577 s-1, kr=0.00385 s-1. The experimental results were obtained by Avram et al. [6] using 10 μM ADP as agonist. References [1] Bizzozero G. 1882 . Ueber einen neuen Forrnbestandteil des Blutes und dessen Rolle bei der Thrombose und Blutgerinnung. Archiv für pathologische Anatomie und Physiologie und für klinische Medicin, 90: 261–332. [2] Born GVR. 1962. Aggregation of blood platelets by adenosine diphosphate and its reversal. Nature 194: 927– 929. [3] Hause, LL, Retzinger, GS, Megan, PA.. 1989. A compartmental model of platelet aggregation in vitro: the kinetics of single platelets. Thromb. Res. 56:133 - 146. [4] Maayani, S. et al. 2001. Deaggregation is an integral component of the response of platelets to ADP in vitro: kinetic studies of literature and original data. Platelets 12:279 - 291. [5] Yabusaki K., Kokufuta E. 2002. Aggregation mechanism of blood platelets by a time-resolved light scattering method. Langmuir 18:39 - 45. [6] Avram S, Lupu A, Angelescu S, Olteanu N, Mut-Popescu D. 2001. Abnormalities of platelet aggregation in chronic myeloproliferative disorders. J. Cell. Mol. Med. 5:79 - 87. Acknowledgements Work supported by the National Center for Program Management in the framework of the Romanian Program for Excellence in Research (CEEX 62/2005) .