Download
1 / 29
290 likes | 293 Views
This text explains the four scales of measurement and the characteristics of distributions. It also discusses different types of average scores, measures of dispersion, correlation coefficients, and approaches to scoring student performance.

E N D
Ch. 4: Test Scores and How to Use Them Dr. Julie Esparza Brown SPED 512/Diagnostic Assessment Portland State University Winter, 2013
Basic Quantitative Concepts Four Scales of Measurement • Nominal: have names for points, no relationship among them (e.g., football players) – seldom used • Ordinal: ordered but no known interval between points (e.g., worst to best) – most frequently used in norm-referenced measurement • Ratio: absolute zero point and a specific interval between points (e.g., weight) – seldom used • Equal Interval: ratio scales without an absolute zero (e.g., temperature) – most frequently used in norm-referenced measurement
Characteristics of Distributions Sets of equal interval scores can be described in terms of four characteristics: • Mean: arithmetic average of the scores • Variance: distance between each score and every other score in the set • Skew: refers to symmetry of a distribution • Kurtosis: describes the rate at which a curve rises and falls
Scales of Measurement • Raw scores convey very little meaning unless transformed to a derived score. • Four types of scores: • Nominal: no inherent relationships among adjacent values • Ex: football jersey numbers, group 1 and 2 • Ordinal: order things from better to worse or vice versa; cannot be added together and averaged • Ex: Percentile rank, age and grade equivalent, rank in class
Scales of Measurement • Four types of scores: • Ratio: differences between adjacent values is equal; there is a logical and absolute zero. • Ex: Counts of behavior, income • Equal interval: also orders things but the difference between the adjacent values is known; scores can be added, subtracted, multiplied and divided • Ex: IQ scores, text scores
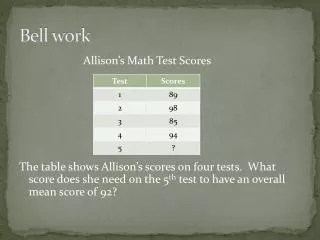
Three Different Types of Average Scores • Mean: the arithmetic average; the sum of the scores divided by the number of scores; can be calculated only for ratio and equal-interval scales. WHY? (most useful) • Median: the point(score) in a distribution above which are 50 percent of test takers (not test scores) and below which are 50 percent of the test takers (not test scores); can be calculated for ordinal, ratio, and equal-interval scales.(second most useful) • Mode: most frequent score in a distribution; can be computed for data on a nominal, ordinal, ratio, or equal-interval scale. (least useful)
Three Measures of Dispersion • Dispersion describes how scores are spread out above and below the average score. • Three measures of dispersion are range, variance, and standard deviation. • Range is the distance between the extremes of a distribution, including those at the extremes. • Variance is a numerical index describing the dispersion of sets of scores around the mean of the distribution. • Standard deviation is the positive square root of the variance and is very important to the interpretation of test scores. Its advantage is that when the distribution is normal, we know how many cases occur between the mean and a particular standard deviation (34% between the mean and one standard deviation, 14% between one standard deviation and two standard deviations). • Variance and standard deviation are the most important indices of dispersion.
Correlation (rxy) • Correlation coefficients: quantify the relationships between variables. These are used in measurement to estimate the reliability and the validity of a test. • They range from −1.00 to +1.00; the higher the number, the greater the predictive power from one variable to the other, with the sign indicating the direction of the relationship. • .00 is no relationship • +1.00 or -1.00 indicates a perfect relationship and the sign indicates the direction of the relationship.
Two Approaches to Scoring Student Performance • Objective: based on observable qualities; less influenced by extraneous factors; leads to greater consistency in scoring • Subjective: relies on personal impressions and private criteria
Five Common Summary Scores • Percent correct: calculated by dividing the number correct by the number possible and multiplying that quotient by 100. • Percent accuracy: the number of correct responses divided by the n umber of attempted responses multiplied by 100. • Rate of correct response: • Instructional level divides the percentage range into three segments: • frustration level (material in which a student knows less than 85% of the material), • instructional level (85-95%), and • independent level (95% or above). • Fluency: is the number of correct responses per minute. It takes into account the rate of performance. • Retention: the percentage of learned material that is recalled. A time frame is usually included in this concept.
Three Common Score Interpretations • Criterion-referenced: interpretations, a student’s performance is compared to an objective and absolute standard of performance • Standards referenced: interpretations (found in large scale assessments measuring attainment of state and national achievement standards), scores are compared to the specified qualities and skills that learners need to demonstrate. This standard typically includes four components: levels of performance, objective criteria, examples, and cut scores. • Norm-referenced: interpretations compare a student’s performance to the performances of other students with similar demographic characteristics. In order to make this comparison, student scores are transformed into a derived score. • Derived scores are developmental scores and scores of relative standing.
Developmental Scores The most common types of developmental scores are: • age equivalents • grade equivalents • They are interpreted as performance equal to the average of X-year-olds’ and average of Xth-graders’ performance, respectively. The interpretation of age and grade equivalents requires great care because of several disadvantages.
Developmental Scores . Disadvantages of AE and GE scores: • First, the fact that a child has achieved the same number correct as an older or a younger child does not mean that the child has performed in the same way as an older or younger child. The child may have answered different problems correctly or may have arrived at the same answer through different processes. • Second, developmental scores are interpolated or extrapolated (that is, estimated) from scores of children in a norm sample. • The third problem is that developmental scores promote typological thinking. There is no such thing as the average X-year-old child. The average child is more correctly thought of as average children—that is, multiple performances in a median range of scores. • Fourth, the way equivalent score are constructed ensures that 50 percent of any age or grade group will perform below age or grade level. This leads to a false standard of performance. At any age or grade level, half of test takers will earn scores below the median. • The fifth problem with developmental scores is that they are probably ordinal, not equal interval, and they are certainly not ratio. Therefore, there are fewer things that one can do statistically with developmental scores.
Scores of Relative Standing: Percentile Family • Percentile scores indicate the percentage of people or scores that occur at or below a given raw score. For example, a percentile of 48 means the score was equal to or better than 48% of test takes OR 53% of test takers earned scores equal to or better. • A decile is a band of percentiles that is 10 percentile ranks in width (e.g., the first decile contains percentile ranks from 0.1 to 9.9). • A quartile is a band of percentiles that is 25 percentile ranks in width (for example, the fourth quartile contains the ranks 75 to 99.9). • Percentile allow for the comparison of performances of several students even when they differ in age or grade. The major disadvantage is that percentiles are not equal interval scores so they cannot be added together or subtracted from one another. • Percentiles can range from 0.1 to 99.9 with the fiftieth percentile rank being the median.
Percentiles (Relative Standing) • The percent of people in the comparison group who scored at or below the score of interest. • Example: • Billy obtained a percentile rank of 42. • This means that Billy performed as well or better than 42% of children his age on the test. • Or, 42% of children Billy’s age scored at or below Billy’s score. • Or, Billy is number 42 in a line of 100 people.
Advantages of Percentiles Ranks • Percentile ranks are one of the best types of score to report to consumers of a child’s relative standing compared to other children. • Percentiles are ordinal. The difference between adjacent values are not the same across the score (unknown) so you cannot combine them to find an average. • The 50th percentile is the median. If the distribution is normal, it is also the mean and mode. • Scores indicate how well a student performed compared to the performance of some reference group,
Scores of Relative Standing: Standard Score Family • Standardized scores often are more difficult to interpret because the concepts are not understood by people without some statistical knowledge. • Other than this disadvantage, standard scores have the advantage of percentiles. • In addition, because they are equal interval, they can be combined.
Scores of Relative Standing: Standard Score Family Standard scores are derived scores with a predetermined mean and standard deviation. • Z-scores (or the z distribution) is the most basic standard score. In a z-distribution, the mean is equal to zero and the standard deviation is equal to one. Z-scores are often transformed into different standard scores with predetermined means and standard deviation. • Four common transformed scores are • 1) T-scores: Mean = 50, SD = 10 • 2) deviation IQs: Mean = 100, SD = 15 • 3) normal-curve equivalents: Mean = 100, SD = 21.06 • 4) stanines: Divides a distribution into nine parts with five standard deviations between each and the first at 1.75 or more standard deviations below the mean and the ninth at 1.75 standard deviations above the mean.
Standard Score Family, cont. • Interpretation: • z-scores are interpreted as being X number of standard deviations above or below the mean. The larger the number, the more above or below the mean is the score. • Positive scores are above the mean; negative scores are below the mean. • When the distribution of scores is bell-shaped or normal, we know the exact percentile that corresponds to a z-score.
Concluding Comments on Derived Scores • Test authors provide tables to convert raw scores into derived scores. • Only when distributions are normal is the relationship between standard scores and percentiles defined. • The relationship between developmental scores and either percentiles or standard scores is unknown.
Concluding Comments on Derived Scores • While standard scores have many advantages, percentile ranks require the fewest assumptions for accurate interpretation and are easily understood. • They simply report what is desired of a norm-referenced score: the individual’s relative standing in a group. • Percentiles also do not carry any excess meaning or aura that is not warranted.
Norms • Normative group allow for the comparison of one person’ performance to the performance of others. To make such a comparison, it is critical to know who is included in the norm group. It is important that people to whom a person’s performance is compared makes sense. • Although entire student populations can be tested with local norms, national norms always involve sampling, and it is essential to know the characteristics of the people sampled. • One of the ways in which norms can be evaluated is by examining the representativeness of the norm group. • Representativenessrefers to whether the norm sample contains individuals with relevant characteristics and experiences, and the extent to which those characteristics and experiences in the sample are in the same proportion as they are in the population of reference.
Norms • Important Characteristics of Norms: • Gender • Age • Grade in School • Acculturation of Parents • Race and Cultural Identity • Geography • Intelligence
Norms, cont. • Proportional Representation • Number of Subjects • Age of Norms • Relevance of Norms
Norms, cont. • An important technical consideration in developing norms is ensuring that there is proportional representation in the norm groups. • The number of subjects in a norm group should be large enough to guarantee stability and also to represent infrequent characteristics. A guideline is that a norm sample should include at least 100 people per age or grade group. • Age of norms—because of changes in knowledge, communication, and the social fabric of the United States, a norm sample must be current to be representative; the definition of “current” is judgmental but probably should never include anything more than 15 years old for ability tests and 7 years for achievement tests. • The relevance of the norms is also important. The major question is about the extent to which people in the norm sample provide comparisons that are relevant in terms of the purpose for which the test was administered.