Download
1 / 18
180 likes | 337 Views
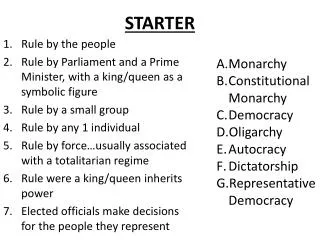
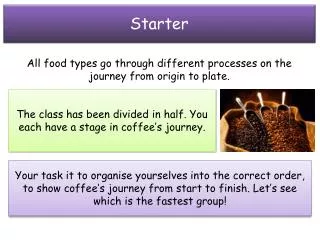
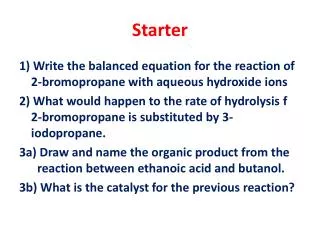
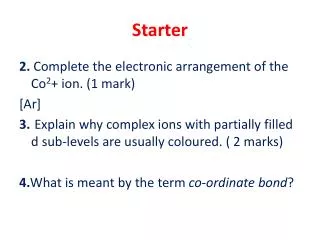
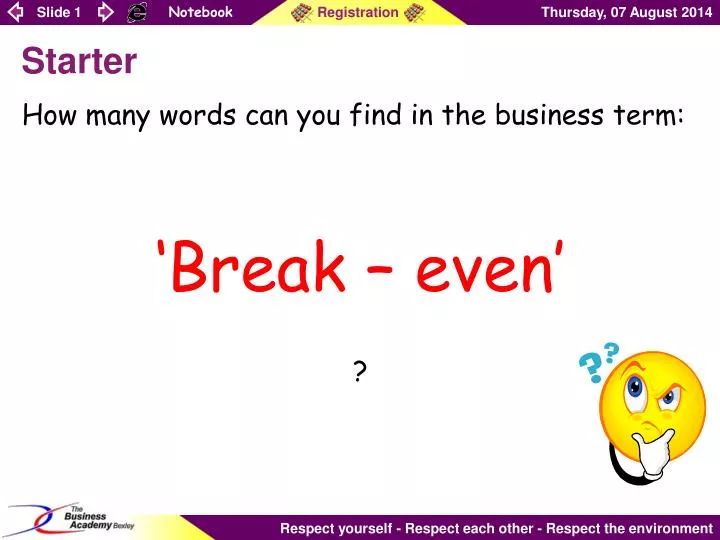
Starter. How many words can you find in the business term: ‘Break – even’ ?. The Big Picture. Our lesson objective is… To learn how to draw break – even charts By the end of this lesson: All students can differentiate between fixed and variable costs

E N D
Starter How many words can you find in the business term: ‘Break – even’ ?
The Big Picture Our lesson objective is… • To learn how to draw break – even charts By the end of this lesson: • All students can differentiate between fixed and variable costs • Most students can show costs on a diagram • Some students can calculate break even point
Break even... Firms spend money making their products. These are called costs. Variable costs = Change depending on output Fixed costs = remain the same no matter how much is produced
Cost sort! Advertising Fixed or variable costs? Electricity costs Rent Interest payments on loans Raw materials Managers’ salaries Maintenance of machinery Overtime pay
Starter Fixed costs Variable costs Rent Electricity costs Advertising Overtime pay Interest payments on loans Raw materials Maintenance of machinery Managers’ salaries
Sales revenue Firms get money from selling their products. This is called sales revenue...
Break even... Break even is the point at which the sales are exactly the same as the costs. Total costs = Fixed costs + variable costs Sales revenue = Selling price x number of units sold Profit = Sales revenue – total costs
Evans Cricket Bats Ltd Stage 1: Complete this table...
Evans Cricket Bats Ltd Check your answers...
Stage 2: Showing costs on a graph... Turn your paper so it is LANDSCAPE and copy this... Costs (£) 1000 2000 3000 4000 Output (No of cricket bats)
Showing costs on a graph... Insert fixed costs Costs (£) 1000 2000 3000 4000 Output (No of cricket bats)
Showing costs on a graph... Add in variable costs... Costs (£) 1000 2000 3000 4000 Output (No of cricket bats)
Showing costs on a graph... Calculate total costs... Fixed costs Variable costs Costs (£) Total costs 1000 2000 3000 4000 Output (No of cricket bats)
Showing revenue on a graph Now add revenue to your graph.... Fixed costs Variable costs Costs (£) Total costs 1000 2000 3000 4000 Output (No of cricket bats)
Showing revenue on a graph Now add revenue to your graph.... Fixed costs Costs and sales revenue (£) Variable costs Total costs Sales revenue 1000 2000 3000 4000 Output (No of cricket bats)
Break – even tasks... • Now have a go at the break – even exercise sheets...
Check your work How did you get on?
Review What have you learnt today?