Download
1 / 18
180 likes | 296 Views
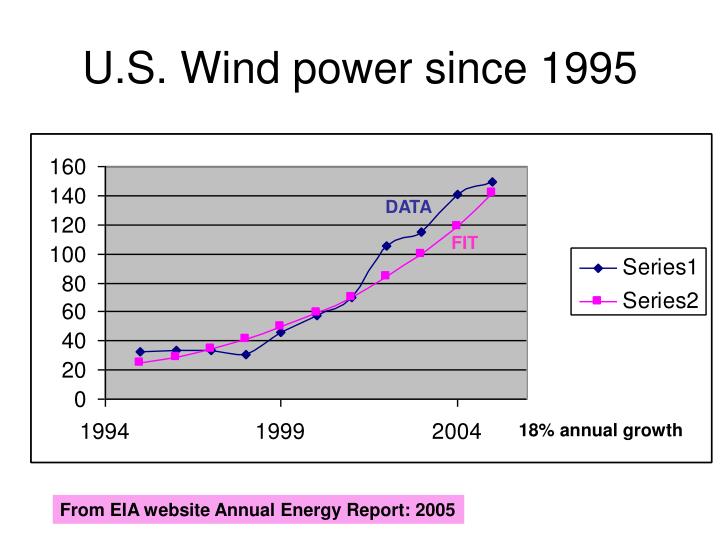
U.S. Wind power since 1995. DATA. FIT. 18% annual growth. From EIA website Annual Energy Report: 2005. Hubbert Curve. World Coal Production Curve. Exponential extrapolation. Data. Finite resource -> Final answer is 0. H&K fig. 1.11.

E N D
U.S. Wind power since 1995 DATA FIT 18% annual growth From EIA website Annual Energy Report: 2005
Hubbert Curve World Coal Production Curve Exponential extrapolation Data Finite resource -> Final answer is 0 H&K fig. 1.11 Exponential growth CANNOT be sustained in a World of FINITE resources!!
Energy Conversions (Table 2.2) digestion thermal Automatically Happens! A key question to consider is with what EFFICIENCY can each of these Conversions be accomplished (Useful energy output/ total energy input)
Inside a Nuclear Power Plant http://science.howstuffworks.com/nuclear-power.htm
Seoinchon (?) Power plant: 57% i.e. for every 1000J of energy that comes into the plant (as natural gas), only 570 J, or only a bit more than half, goes out as useful electricity. In the next chapter, we will see that conversions on down the line are also less than 100% efficient. Conventional power plants may be closer to only 35%-40% efficient!
Energy Losses in a Car http://www.fueleconomy.gov/feg/atv.shtml NOTE: only 13% gets to the wheels and ALL of that goes to thermal energy (eventually) See also: http://www.fueleconomy.gov/feg/hybrid_sbs_cars.shtml
CAFE standards(Corporate AverageFuel Economy)From the D.O.T. http://www.nhtsa.gov/cars/rules/CAFE/docs/Summary-Fuel-Economy-Pref-2004.pdf
CAFE performance standard http://dmses.dot.gov/docimages/pdf102/480389_web.pdf
ITAIPU (Brazil/Paraguay) http://www.solar.coppe.ufrj.br/itaipu.html
http://www.solar.coppe.ufrj.br/itaipu.html ITAIPU (Brazil/Paraguay) 18 turbines, each producing roughly 715 MW 12.9 GW total output! (700 m3/s, effective height ~110m for each turbine)
LA Water&Power 2006 IR-plan http://www.ladwp.com/ladwp/cms/ladwp008065.pdf
LA Water&Power 2006 IR-plan http://www.ladwp.com/ladwp/cms/ladwp008065.pdf
Residential Electric Power Bill $145.6/1948 kWh = $0.0747/kWh
Commercial Power Costs Energy cost estimates for a project out at IUCF: use (i.e. energy) charge: $3105/(360hr*575kW)=$0.0147/kWh peak use (i.e. maximum power demand) charge: $13.11/kW Why is this different from the residential calculation?
Not all hybrids are created equal! http://www.fueleconomy.gov/feg/hybrid_sbs.shtml