Download
1 / 2
80 likes | 474 Views
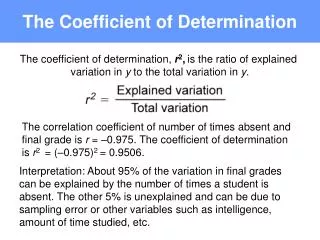
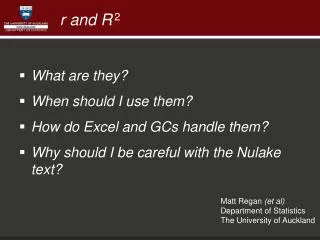
2.5 The coefficient of determination (r 2 ) & correlation (r) ¿How good is the estimated regression line? Since residuals are (+) & (-), that is, the estimated values are different than those observed we should get an indication of the “goodness of fit”

E N D
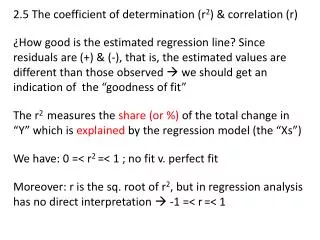
2.5 The coefficient of determination (r2) & correlation (r) ¿How good is the estimated regression line? Since residuals are (+) & (-), that is, the estimated values are different than those observed we should get an indication of the “goodness of fit” The r2 measures the share (or %) of the total change in “Y” which is explained by the regression model (the “Xs”) We have: 0 =< r2 =< 1 ; no fit v. perfect fit Moreover: r is the sq. root of r2, but in regression analysis has no direct interpretation -1 =< r=< 1
2.5 The coefficient of determination (r2) & correlation (r) Other ways to check the goodness of fit: • Variance / std. error of the model • Joint hypotheses test (F-test) These will serve for model selection, assessing the variability in the observed “Y” in relation to those explained In addition, the variances (& std. errors) of the estimated coefficients give us an idea of the variability of the coefficients from sample to sample Given GM with CLRM & LS the variability is minimum