Download
1 / 24
240 likes | 253 Views
2.1 Functions and their Graphs. page 67. Learning Targets. I can determine whether a given relations is a function. I can represent relations and function. I can graph and evaluate linear functions. Relations. A relation is a mapping, or pairing, of input values with output values.

E N D
2.1 Functions and their Graphs page 67
Learning Targets • I can determine whether a given relations is a function. • I can represent relations and function. • I can graph and evaluate linear functions.
Relations • A relation is a mapping, or pairing, of input values with output values. • The set of input values is called the domain. Also called x-coordinate. • The set of output values is called the range. Also called y-coordinate. • A relation as a function provided there is exactly one output for each input. NOTE: x values do not repeat. • It is NOT a function if at least one input has more than one output
Functions • A function is a relation in which the members of the domain (x-values) DO NOT repeat. • So, for every x-value there is only one y-value that corresponds to it. • y-values can be repeated.
Identify the Domain and Range. Then tell if the relation is a function. Input (x-values)Output (y-values) -3 3 1 -2 4 1 4 Domain = {-3, 1,4} Range = {3,-2,1,4} Notice the set notation!!! Function? No: input 1 is mapped onto Both -2 & 1 . X repeats.
Identify the Domain and Range. Then tell if the relation is a function. InputOutput -3 3 1 1 3 -2 4 Function? Yes: each input is mapped onto exactly one output x values do not repeat Domain = {-3, 1,3,4} Range = {3,1,-2}
A Relation can be represented by a set of orderedpairs of the form (x,y) Quadrant I X>0, y>0 Quadrant II X<0, y>0 Origin (0,0) Quadrant IV X>0, y<0 Quadrant III X<0, y<0
Graphing Relations • To graph the relation in the previous example: • Write as ordered pairs (-3,3), (1,-2), (1,1), (4,4) • Plot the points
(4,4) (-3,3) (1,1) (1,-2)
(-3,3) (1,1) (3,1) (4,-2)
Vertical Line Test • You can use the vertical line test to visually determine if a relation is a function. • Slide any vertical line (pencil) across the graph to see if any two points lie on the same vertical line. • If there are no two points on the same vertical line then the relation is a function. • If there are two points on the same vertical line then the relation is NOT a function
Use the vertical line test to visually check if the relation is a function. (4,4) (-3,3) (1,1) (1,-2) Function? No, Two points are on The same vertical line.
Use the vertical line test to visually check if the relation is a function. (-3,3) (1,1) (3,1) (4,-2) Function? Yes, no two points are on the same vertical line
x x y y Does the graph represent a function? Yes Yes
x x y y Does the graph represent a function? No No
x x y y Does the graph represent a function? Yes No
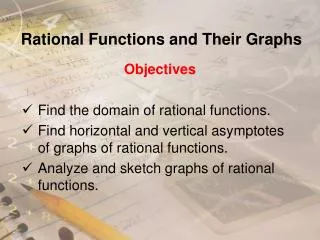
Graphing and Evaluating Functions • Many functions can be represented by an equationin 2 variables: y=2x-7 • An ordered pair is a solution if the equation is true when the values of x & y are substituted into the equation. • Ex: (2,-3) is a solution of y=2x-7 because: • -3 = 2(2) – 7 • -3 = 4 – 7 • -3 = -3
In an equation, the input variable is called the independent variable. • The output variable is called the dependent variable and depends on the value of the input variable. • In y=2x-7 ….. X is the independent var. Y is the dependant var. • The graph of an equation in 2 variables is the collection of all points (x,y) whose coordinates are solutions of the equation.
Graphing an equation in 2 variables • Construct a table of values • Graph enough solutions to recognize a pattern • Connect the points with a line or curve
Graph: y = x + 1 Step 3: Step2: Step 1 Table of values
Function Notation • By naming the function ‘f’ you can write the function notation: • f(x) = mx + b • “the value of f at x” • “f of x” • f(x) is another name for y (grown up name) • You can use other letters for f, like g or h
Decide if the function is linear. Then evaluate for x = -2 • f(x) = -x2 – 3x + 5 • Not linear…. • f(-2) = -(-2)2 – 3(-2) + 5 • f(-2) = 7 • g(x) = 2x + 6 • Is linear because x is to the first power • g(-2) = 2(-2) + 6 • g(-2) = 2 • The domain for both is….. • All reals
Pair-Share • Pp. 71-72 #5-48 (Even Number Only)