Download
1 / 1
10 likes | 174 Views
Water Quality Upstream-Site 49 Downstream-Site 111. Background The Snake Creek Reservoir was impounded in late 2001. It is located just east of Carrollton Georgia and provides part of the county’s drinking water supply. It is the newest and largest reservoir in Carroll County.

E N D
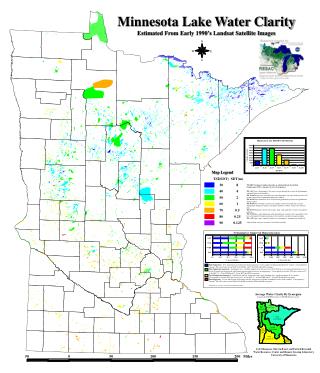
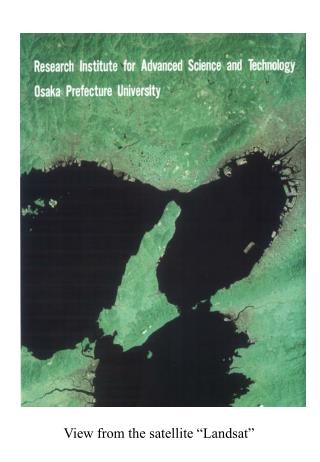
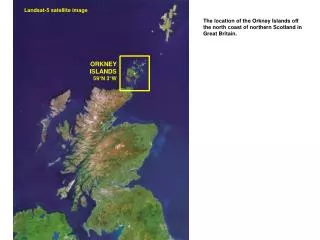
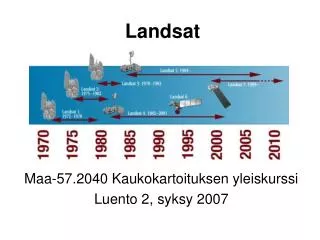
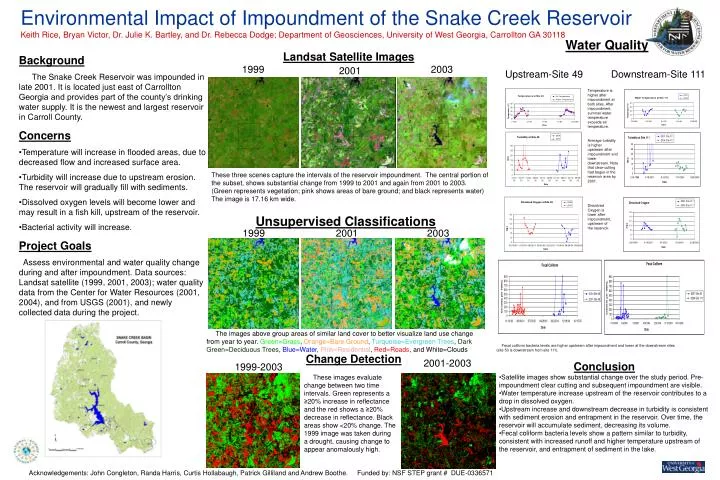
Water Quality Upstream-Site 49 Downstream-Site 111 • Background • The Snake Creek Reservoir was impounded in late 2001. It is located just east of Carrollton Georgia and provides part of the county’s drinking water supply. It is the newest and largest reservoir in Carroll County. • Concerns • Temperature will increase in flooded areas, due to decreased flow and increased surface area. • Turbidity will increase due to upstream erosion. The reservoir will gradually fill with sediments. • Dissolved oxygen levels will become lower and may result in a fish kill, upstream of the reservoir. • Bacterial activity will increase. • Project Goals • Assess environmental and water quality change during and after impoundment. Data sources: Landsat satellite (1999, 2001, 2003); water quality data from the Center for Water Resources (2001, 2004), and from USGS (2001), and newly collected data during the project. 1999 2003 2001 Environmental Impact of Impoundment of the Snake Creek ReservoirKeith Rice, Bryan Victor, Dr. Julie K. Bartley, and Dr. Rebecca Dodge; Department of Geosciences, University of West Georgia, Carrollton GA 30118 Temperature is higher after impoundment at both sites. After impoundment, summer water temperature exceeds air temperature. Average turbidity is higher upstream after impoundment and lower downstream. Note that clear-cutting had begun in the reservoir area by 2001. These three scenes capture the intervals of the reservoir impoundment. The central portion of the subset, shows substantial change from 1999 to 2001 and again from 2001 to 2003. (Green represents vegetation; pink shows areas of bare ground; and black represents water) The image is 17.16 km wide. Dissolved Oxygen is lower after impoundment, upstream of the reservoir. Unsupervised Classifications 1999 2001 2003 Landsat Satellite Images The images above group areas of similar land cover to better visualize land use change from year to year. Green=Grass, Orange=Bare Ground, Turquoise=Evergreen Trees, Dark Green=Deciduous Trees, Blue=Water, Pink=Residential, Red=Roads, and White=Clouds Fecal coliform bacteria levels are higher upstream after impoundment and lower at the downstream sites (site 50 is downstream from site 111). Change Detection 2001-2003 • Conclusion • Satellite images show substantial change over the study period. Pre-impoundment clear cutting and subsequent impoundment are visible. • Water temperature increase upstream of the reservoir contributes to a drop in dissolved oxygen. • Upstream increase and downstream decrease in turbidity is consistent with sediment erosion and entrapment in the reservoir. Over time, the reservoir will accumulate sediment, decreasing its volume. • Fecal coliform bacteria levels show a pattern similar to turbidity, consistent with increased runoff and higher temperature upstream of the reservoir, and entrapment of sediment in the lake. 1999-2003 These images evaluate change between two time intervals. Green represents a ≥20% increase in reflectance and the red shows a ≥20% decrease in reflectance. Black areas show <20% change. The 1999 image was taken during a drought, causing change to appear anomalously high. Acknowledgements: John Congleton, Randa Harris, Curtis Hollabaugh, Patrick Gilliland and Andrew Boothe. Funded by: NSF STEP grant # DUE-0336571