Download
1 / 75
750 likes | 1k Views
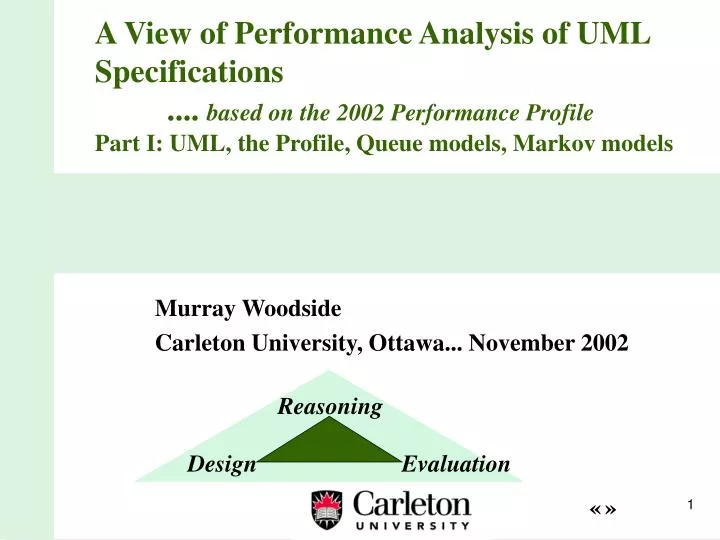
Reasoning Design Evaluation. A View of Performance Analysis of UML Specifications .... based on the 2002 Performance Profile Part I: UML, the Profile, Queue models, Markov models. Murray Woodside Carleton University, Ottawa... November 2002. « ».

E N D
Reasoning Design Evaluation A View of Performance Analysis of UML Specifications .... based on the 2002 Performance ProfilePart I: UML, the Profile, Queue models, Markov models Murray Woodside Carleton University, Ottawa... November 2002 «»
(A) Motivation and Viewpoints Motivation of this work: • a performance model is a behaviour abstraction of a system • it averages over variations in use • it supports evaluation of time properties • it supports reasoning about the design itself • including extrapolation • automated model building will make performance analysis accessible, fast and maintainable • once a performance problem is identified it is “obvious” • thus the hypothesis: designers can understand the results without understanding the techniques
UML is a specification language.What is a Specification? • A Model. We construct models to learn about the interesting properties of a system... • Without having to construct the actual system (cost) • Without having to experiment with the actual system (availability) • Without having to view the entire system — because it may be too complex to understand • A Definition, • ...from which more specialized definitions (such as code for a specific platform) can be generated • .... there are other specification languages too
Platform Independence vs Real-time Software • Platform independence: design the program logic to be independent of the implementation platform • separation of concerns • software portability • Real-time software: • correct functioning depends on time • hard deadlines, or soft targets • this depends on the platform, and on scheduling... • ... and on interference from other factors • e.g. network delays, failures • THUS, there must be engineering tradeoffs between the logic and the platform/environment
UML (Unified Modeling Language) • lightweight formalism driven by what designers use • a union of various ideas in object oriented modeling • united via a meta-model and an “Object Constraint Language” • introduced by Rational, standardized by OMG Object Management Group) • industrial standards body, companies are members • www.omg.com • UML, CORBA, MDA • UML is the basis of the “Model-Driven Architecture” (MDA) initiative • “the design is the implementation” • code generation from UML 2.0
2003-2004 Rumbaugh Booch Jacobson 2001 1998 1997 1996 2002 1967 The Evolution of UML (from Bran Selic’s WOSP 2002 Tutorial) UML 2.0 (MDA) UML 1.4.1 UML 1.4 (action semantics) UML 1.3 (extensibility) UML 1.1 (OMG Standard) Foundations of OO (Nygaard, Goldberg, Meyer,Stroustrup, Harel, Wirfs-Brock, Reenskaug,…)
What are software performance concerns? Request Response Quantitative measures: • Delay from Request to Response: • mean and variance • delay value at percentile X (e.g. 95% value) • max delay is useful for deadlines (100% percentile value) • distribution, or approx by a set of percentiles • jitter, for media streams like voice and video: • deviation from an equally spaced delivery schedule • but, what measure to use? • e.g., jitter relative to a fixed or a varying baseline • measure may depend on the use made of the outputs System
Performance concerns (2): more measures Request Response System • Throughput of requests or responses: • mean rate per sec. • number in a stated interval (mean, variance, distribution) • interarrival time distribution • Poisson, deterministic, bounded below (needed for deadline analysis) • bursty or dependent • batches, heavy-tailed • open vs closed arrivals (infinite vs finite source) • Resource Utilization • fraction of time busy • hardware and software resources
Performance concerns (3) System hot More general characterstics: • Where are the sensitive parameters? • operation demands with a significant impact • Location of bottlenecks • “hot spots” • while these are really quantitative, they are also somewhat insensitive, so they are stable while parameters change over a certain range • Scalability limits • users, interfaces, locations • transaction sizes
Information Requirements of Performance Concerns... • a performance model requires: • performance requirements for stated responses • behaviour for stated responses • resource demands for physical resources • characteristics of physical resources (speed) • scheduling • concurrency • identification and use of logical resources • timing specifications (e.g. timeouts) • characteristics of environment services • completions (ICSE 2002 paper) (e.g. file services, databases)
Performance Analysis: Three Viewpoints • Three views of the same system (1995 paper in IEEE TSE) • specialized for different activities • Connections between the views to support design activities MAP View (architecture and structure) (UML class and object diagrams) PATH View (scenarios) (UML behaviour diagrams and Use Cases) (maps to responses and requirements) RESOURCE View (physical and logical resources, and how the design loads them) (UML deployment diagram and SPTProfile)
Where the View information is defined Described by UML MAP View PATH View RESOURCE View Described by the Profile on Schedulability, Performance and Time (SPT Profile) Described by the analyst
Connections between the views ...location of path segments ...objects used for activities MAP PATH ... resources for active objects ... allocation and containment of operations ...sub-path executed while holding a given resource ...resources used by an activity RESOURCE
(B) UML Model Views (Diagrams) (acknowledgements to Bran Selic’s WOSP2002 tutorial) • Requirements (use case diagrams) • Static structure (class diagrams) • kinds of objects and their relationships • Object behavior (state machines) • possible life histories of an object • Inter-object or system behavior (activity, sequence, and collaboration diagrams) • flow of control among objects to achieve system-level behavior • Physical implementation structures (component and deployment diagrams) • software modules and deployment on physical nodes
Fail one engine Prepare flight «include» Run checklist Land plane Use Case Diagrams • Used to capture functional requirements • useful as principal drivers of the overall development process AircraftSimulator Use case instructor actor trainee
Use Cases and Performance Concerns • As useful as in any other domain • fundamental drivers of system definition, development, and testing • However…. • Focus on function (functional requirements) • In RT systems, much focus on non-functional requirements • e.g., end-to-end delays, maximum response times,… • Even though UML is a standard, there is no standard way of associating such non-functional requirements with use cases
0..* Flight route start duration Captain First Officer Class Diagram • Shows the kinds of entities in a system and their general relationships Association class Pilot designatedPlane crew Airplane 1..* 1 Association 0..* owner 0..* {ordered} Airline 1
Donald D. : Pilot N1313:Airplane Mickey M. : Pilot CA345 : Flight CA123 : Flight DecrepitAir : Airline CreakyAir : Airline Object Instance Diagram • Shows object instances in a particular case of a general class diagram Link
N2:Node Node N1:Node N3:Node N4:Node N1:Node N2:Node N3:Node Class Diagrams and Performance Concerns • Because they abstract out certain specifics, class diagrams are not suitable for performance analysis • However they can be used to define default attributes of the objects created from a class
/CallProc 2.call() 3.sendTone() /PhoneIF /ToneGen 4.dialtone() 1.offHook() Collaboration Diagram • Depict generic structural and behavioral patterns Classifier role NB: It is possible to havecollaboration diagramswithout an Interaction overlay (“pure” structure) Message: part of an Interaction
/Caller /Operator /Callee call number call ack ack transfer talk time Sequence Diagrams • Show interactions between objects with a focus on communications (a different representation of a collaboration)
Sequence Diagrams and Performance Concerns • Sequence diagrams are extremely useful for showing object interactions • very common, particularly in real-time systems • well suited for event-driven behavior • in telecom, many protocol standards are defined using sequence diagrams • However… • No standard way of denoting performance requirements • Very limited capabilities for specifying timing constraints and characteristics • Do not scale up to complex systems
master : Master d : DBaseServer cs : CommServer read( ) register( ) Using Timing Marks with Sequence Diagrams • Specifying constraints { ( register.receiveTime ( ) - read.sendTime( ) ) 2 ms}
Acknowledge Acknowledge Activity Diagrams • Different focus compared to sequence diagrams /Caller /Operator /Callee activity ContactOperator ContactCallee swimlane Respond Notify Parties
Activity Diagrams and Performance Concerns • Better than sequence diagrams for • showing concurrency (forks and joins are explicit) • scaling up to complex systems • However… • No standard way of denoting performance requirements and timing characteristics • Less well-suited for describing event-driven behavior • activities are not associated to method calls or messages in a class diagram, or to sequence diagrams
LampOff LampFlashing flash/ entry/lamp.off() FlashOn entry/lamp.on() off/ 1sec/ 1sec/ on/ FlashOff on/ LampOn entry/lamp.off() entry/lamp.on() UML Statechart Diagrams • Very suitable for specifying complex event-driven behavior
State Machines and Performance Concerns • Many software systems are event-driven • very well suited to those systems • Hierarchical capabilities scale up very nicely • However… • not directly connected to time (except for time events) • not all classes have them • default call-return behaviour would have to be inferred • associated with a class, rather than an instance • bindings of messages and events between state machines must be complete • responses are buried in them
InitializeObject Wait forRequest InitializeObject HandleRequest Wait forRequest HandleRequest TerminateObject TerminateObject Objects and Concurrency • Passive objects: have no control of their communications • Clients determine when to invoke an operation • Active objects: can control when to respond to requests • Can avoid concurrency conflicts • Require at least one independent engineering-level thread
UML Concurrency Model • Active objects are the major concurrency mechanism of UML • automatically resolve certain classes of concurrency conflicts • However... • Not clear how this model maps to concurrency mechanisms that are used in the real-time domain (processes, threads, semaphores, real-time scheduling methods, etc.)? • The actual scheduling policy is unspecified • A semantic variation point • Can be customized to suit application requirements
:Scheduler reservations :Planner update :GUI Component and Deployment Diagrams • Implementation focus: Component Node Generally not sophisticated enough for complex real-time system needs
Implementation Diagrams and Performance Concerns • Probably the weakest part of UML • Not sophisticated enough to capture the various complex aspects of deployment common to many performance sensitive systems • deferred mapping of software to hardware • mapping of software to software • No standard way to describe the quantitative requirements/characteristics of hardware and software (e.g., scheduling discipline, CPU speed, transmission delays)
Summary: UML and Performance Sensitive Systems • Using UML for performance sensitive systems automatically brings the benefits of the object paradigm • structural focus, inheritance, strong encapsulation, polymorphism,… • However, there are many open questions • best ways of using UML • missing or non-standard concepts • ability to create predictive models
(C) An Overview of the UML Profile for Schedulability, Performance and Time (SPT Profile) • A profile is an extension to the semantics of UML that conforms to the meta-model • a specialization, inheriting from the UML standard • a domain-specific interpretation • e.g. UML for eCommerce • It should use only standard extension mechanisms: stereotypes, tag values, constraints • additional semantic constraints cannot contradict the general UML semantics • within the “semantic envelope” defined by the standard
«clock» Specializing UML: Stereotypes and tagged values • a stereotype is a specialization of a UML entity, implying a certain interpretation An example of the UMLClass concept «clock» Stereotype of Class with added semantics: an active counter whose value changes synchronously with the progress of physical time ...a stereotype can extend the class Integer Tagged value associatedwith the «clock» stereotype: tag = value value has a type such as: integer ‘sec’|‘ms’|‘ns’ MyClockClass {resolution = 500 ns} SetTime()
Guiding Principles for the SPT Profile • Adopted as OMG standard in March 02 (ptc/2002-03-02) • Ability to specify quantitative information directly in UML models • key to quantitative analysis and predictive modeling • Flexibility: • users can model their real-time systems using modeling approaches and styles of their own choosing • open to existing and new analysis techniques • Facilitate the use of analysis methods • eliminate the need for a deep understanding of analysis methods • as much as possible, automate the generation of analysis models and the analysis process itself • Using analysis results for: • predicting system characteristics (detect problems early) • analyze existing system (sizing, capacity planning)
Stereotypes in the SPT Profile • grouped into sub-profiles • Resources (general resource model GRM) • e.g. GRMacquire • Time (real time RT) • e.g. RTclock • Concurrency (CR) • e.g. CRAction • Schedulability analysis (SA) • e.g. SAAction, SASResource • Performance analysis (PA) • e.g. PAScenario, PAStep • we will look at some of these
Resources and Services ...in the General Resource Model (GRM) • Resource: • an element whose service capacity is limited, directly or indirectly, by the finite capacities of the underlying physical elements • Resources offer services that have QoS attributes Resource R ...... set of services Si ...... QoS of Si • «GRMacquire» is a stereotype that can be applied to a wide range of base classes • stimulus, message, method, action, transition.... • it has two tags: • GRMblocking (boolean) • GRMexclservice (reference to an action etc performed while the resource is held)
Quality of Service (QoS): • a specification (usually quantitative) of how well a particular service is (to be) performed • offered, • required • an attribute of the service, stereotyped as some kind of action or scenario • specified by tagged values • offered QoS requires a system analysis since it depends on load
Resource Usages • the same service can be used in multiple contexts (different users, different demands)... each is a usage • demand associated with each • static usage is “simple” and just has a demand • no nested behaviour • a dynamic usage is defined by a scenario • Categories of resources: • passive/active • protected/unprotected (e.g. stereotype «GRMprotResource») • a protected resource has access control • Access control: exclusive, non-exclusive
Time • existing UML has time attributes defined for events • timing marks • message.sendTime, message.receiveTime • the profile tries to go into depth • discrete vs “dense” (e.g., real-valued) time values • complex union type RTtimeValue for values • stereotypes for • events with significant times (e.g. RTclkInterrupt) • timer, clock
P=0.44 P=0.28 P=0.28 0 ms 1 ms 2 ms 3 ms Time Value • tag type RTtimeValue can represent a wide variety of types related to time, such as: • 12:04 (time of day) • 5.3, ‘ms’ (time interval) • 2000/10/27 (date) • Wed (day of week) • $x, ‘ms’ (parameterized value with name $x) • ‘poisson’, 5.4, ‘sec’ (time value with a Poisson distribution) • ‘histogram’ 0, 0.28 1, 0.44 2, 0.28, 3, ‘ms’
Behaviour abstraction in the SPT Profile • performance analyses sequences of operations • the SA sub-profile has SAaction as its unit, with simple precedence (no probabilities of branching) • suitable for deterministic analysis • the Performance Analysis (PA) sub-profile has a more complex Scenario stereotype • a Scenario is a sequence of Steps • a Step has predecessors (giving AND fork and join) • and also a probability (giving OR f/j, with suitable interpretation) • a Step inherits from Scenario, so it can be refined as a sub-scenario
Scenario (cont’d) • Scenario has a first Step, which is stereotyped with a workload definition • PAopenLoad with tags for an arrival process and a response time • PAclosedLoad with tags for a population and a think time, and a response time. • Step has demands • PAhostDemand tag gives the CPU demand (RTtimeValue) • PAextOp tag defines operations such as file operations, that are not modeled in the UML model but are needed for the performance model (completions) • PAdelay specifies a delay that may be part of the operation (a “sleep” time)
Logical Model Engineering Model Example: Web Video Application b : ws : Browser WebServer vw : vs : vp : VideoWindow VideoServer VideoPlayer «deploys» «deploys» «deploys» WebServerNode ClientWorkstation Internet VideoServerNode
Web Video Application Behaviour b : Browser ws : WebServer vs : vp : vw : VideoServer VideoPlayer VideoWindow processSelection delay initialPlayout initializePlayer confirm sendFrame showFrame *N interval jitter terminalPlayout
Web Video: Performance Parameters • Est. video server processing demand per frame = 10 ms • Est. mean viewer processing demand per frame = 15 ms (standard deviation = 20 ms) • Assumed network delay distrib. is exponential, mean = 10 ms • Measured packets per frame (LAN) = 65 • Measured video server file operations per frame = 12 • Max. number of concurrent users = $Nusers • Average inter-session times = 20 minutes • Frames in a video = $N • Video frame intervval = 30 ms • Required confirmation delay: 95% percentile < 500 ms • Required interval between frame displays: 99% percentile value < 30 ms
Annotated Sequence Diagram «PAcontext» b : Browser ws : WebServer vs : vp : vw : VideoServer VideoPlayer VideoWindow «PAclosedLoad» processSelection «PAstep» ation = $NUsers, {PApopul {PArep = $N, PAextDelay = (‘assm’, ‘mean’, (20, ‘ms’))} initialPlayout initializePlayer PAdemand = ( confirm ‘assm’, ‘mean’, (10, ‘ms’)), PAextOp = (‘filesys’, 12), «PAstep» PAextOp = (‘network’, 65)} {PAdemand = (‘assm’, ‘mean’, 1, ‘ms’)} sendFrame «PAstep» {PArespTime = (‘req’, ‘percentile’, 95, (500, ‘ms’) PArespTime = (‘pred’,percentile,95, $R)} showFrame Result «PAstep» * {PAdemand = terminalPlayout (‘assm’, ‘mean’, 15, ‘ms’), «PAstep» (‘assm’, ‘sigma’, 10 )} {PAinterval = Result (‘req’, ‘percentile’, 99, 30, ‘ms’) Painterval = (‘pred’, percentile, 99, $T)}
«PAcontext» b : Browser ws : WebServer vs : vp : vw : VideoServer VideoPlayer VideoWindow «PAclosedLoad» «PAclosedLoad» processSelection {PApopul ation = $NUsers, «PAstep» «PAstep» {Papopulation = $Nusers, PAextDelay = (‘assm’, ‘mean’, (20, ‘ms’))} PAextDelay = (‘assm’, ‘mean’, (20, ‘ms’))} initialPlayout {Parep = $N, Pademand = (‘assm’, ‘mean’, (10, ‘ms’)), PAextOp = ( ‘filesys’, 12 ), PAextOp = ( ‘network’, 65)} initializePlayer {PArep = $N, confirm PAdemand = ( ‘assm’, ‘mean’, (10, ‘ms’)), PAextOp = (‘filesys’, 12), PAextOp = (‘network’, 65)} «PAstep» Result Result «PAstep» {PAdemand = {PArespTime = (‘req’, ‘percentile’, 95, (500, ‘ms’) PArespTime = (‘pred’,percentile,95, $R)} (‘assm’, ‘mean’, 1, ‘ms’)} «PAstep» sendFrame {PArespTime = (‘req’, ‘percentile’, 95, (500, ‘ms’) PArespTime = (‘pred’,percentile,95, $R)} showFrame «PAstep» * {PAdemand = terminalPlayout «PAstep» (‘assm’, ‘mean’, 15, ‘ms’), «PAstep» (‘assm’, ‘sigma’, 10 )} {PAinterval = {PAinterval = (‘req’, ‘percentile’, 99, 30, ‘ms’) Painterval = (‘pred’, percentile, 99, $T)} (‘req’, ‘percentile’, 99, 30, ‘ms’) Painterval = (‘pred’, percentile, 99, $T)} Result Result Annotations... closer view
Scenario Model as a Activity Diagram «PAcontext» b : Browser vw : VideoWindow vp : VideoPlayer ws : WebServer vs : VideoServer «PAclosedLoad» {PApopulation = $NUsers, <<Pastep>> <<PAstep>> >> PAextDelay = ( ‘assm’, ‘mean’, 20, ‘ms’)} select handle service selection {Pademand= {PArespTime = Result (‘assm’, ‘mean’, 1, ‘ms’)} (‘req’, ‘percentile’, 95, 500, ‘ms’)} <<PAstep>> initiate <<PAstep>> playout <<PAstep>> • Steps are stereotypes of activities • a step can have an inner scenario confirm initialize player {PArep = $N} composite activity (see next page) <<PAstep>> send video [moreFrames] [~moreFrames] <<PAstep>> send terminate <<PAstep>> terminate player
Composite Activity: Detailed Diagram «PAcontext» • Detailed model for the composite activity from the previous page (represented by a SubactivityState) vs : VideoServer vp : VideoPlayer vw : VideoWindow «PAstep» {PAdemand=(‘assm','mean',10,'ms'), send PAextOp=('filesys',12),('network',65)} frame {PAdemand= «PAstep» ((‘assm','mean',15,'ms'), receive ('est','sigma',10))} frame «PAstep» {PAinterval= Result show ('req','percentile',99,30,'ms')}} frame