Download
1 / 21
210 likes | 218 Views
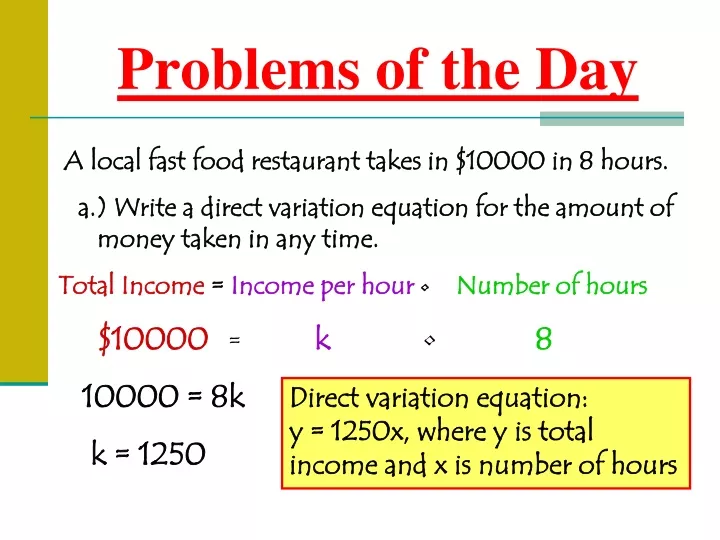
Problems of the Day. A local fast food restaurant takes in $10000 in 8 hours. a.) Write a direct variation equation for the amount of money taken in any time. Total Income = Income per hour • Number of hours $10000 = k • 8 10000 = 8k

E N D
Problems of the Day A local fast food restaurant takes in $10000 in 8 hours. a.) Write a direct variation equation for the amount of money taken in any time. Total Income = Income per hour•Number of hours $10000 = k• 8 10000 = 8k k = 1250 Direct variation equation: y = 1250x, where y is total income and x is number of hours
b.) How many hours would it take for the restaurant to earn $22,500? y = 1250x 22,500 = 1250x x = 18 hours Remember, the direct variation equation is y = 1250x, where y is total income and x is number of hours
Problems of the Day c.) Find the slope of the line that contains (–7, 8) and (– 7, –4). d.)Find the value of r so that the line through (-5, r) and (1, 3) has a slope of 7/6.
Chapter 5.3 Slope-Intercept Form You have seen that you can graph a line if you know two points on the line. Another way is to use the point that contains the y-intercept and the slope of the line.
Important Vocabulary!! Slope – The ratio of the change in the y- coordinates (rise) to the change in the x-coordinates (run) as you move from one point to another along a line. Y-intercept – The coordinate at which a graph intersects the y-axis. The point (0, #)
Ex. 1 - Identifying the slope and y-intercept of the line. 1 Slope? Y-intercept? -6
Step 2 Slope = Count 2 units downand 5 units right from (0, 4) and plot another point. Ex. 2 - Graph the line given the slope and y-intercept. y intercept = 4 y • Rise = –2 • • Step 1 The y-intercept is 4, so the line contains (0, 4). Plot (0, 4). • Run = 5 Step 3 Draw the line through the two points.
Step 2 Slope = Count 2 units upand 1 unit right from (0, –3) and plot another point. Ex. 3 - Graph the line given the slope and y-intercept. slope = 2, y-intercept = –3 Step 1 The y-intercept is –3, so the line contains (0, –3). Plot (0, –3). Run = 1 • Rise = 2 • Step 3 Draw the line through the two points.
** Any linear equation can be written in slope-intercept form by solving for y , (getting y alone)and simplifying. ** In this form, you can immediately see the slope and y-intercept. ** Also, you can quickly graph a line when the equation is written in slope-intercept form.
slope = ; y-intercept = 4 y = x + 4 Example 4 - Write the equation of the line in slope-intercept form. (y = mx + b) y = mx + b ** Remember that your final equation in standard form will have x and y in it to represent any (x, y) solution to the equation.
y = –9x + Example 5 - Write the equation that describes the line in slope-intercept form. slope = –9; y-intercept = y = mx + b
Example 6 – Identify the slope (m) and y-intercept (b) for each equation. a.) y = 3x + 5 b.) y = -4x - ⅓ Remember y = mx + b Slope = 3; y-intercept = 5 Slope = -4; y-intercept = -⅓
Graphing Linear Equations in Slope-Intercept Form b = beginning point: Where the graph crosses the y-axis. Where you begin to draw your line. M = Movement: How you move to get your next point on the graph. Slope = rYse run
y = 3x – 1 is in the form y = mx + b slope: m = 3 = y-intercept: b = –1 Ex. 7 - Graph the line y = 3x - 1 Step 1 Plot (0, –1) {y-intercept} • • Step 2 Count 3 units up and 1 unit right and plot another point. Step 3 Draw the line connecting the two points. x = 0, y = ?; x = 1, y = ?; x = 2, y = ?; x = -1, y = ?
Ex. 8 - Graph the line y = -4x + 2 Slope = -4 y-intercept = 2
Ex. 9 - Graph the line y = x – 4 Slope = 1 y-intercept = -4
Ex. 10 - Graph the line 2x – 3y = 6 First you have to solve y. 2x – 3y = 6 -2x -2x -3y = -2x + 6 -3y = -2x + 6 -3 -3 -3 Slope = y-intercept = - 2
y = x + 0 is in the form y = mx + b. slope: Ex. 11 – Graph the line • • y-intercept: b = 0 ** Remember that you can STILL use a table, pick x-values and solve to find the corresponding y-values in order to graph a linear equation. Slope-intercept form is just an easier alternative.
Ex. 12 – Write the equation of the graphed line in slope-intercept form. Slope (m)? Y-intercept (b)? y = mx + b? ⅓ 2 y = ⅓x + 2
Ex. 13 – Write the equation of the graphed line in slope-intercept form. Slope (m)? Y-intercept (b)? y = mx + b? −¼ −1 y = −¼x- 1
Assignment • Skills Practice Worksheet 5-3 (In-Class) • Pages 275–276 #’s14-27(all), 28-38 (even), (On Graph Paper), 40-44(all). (Homework) • Quiz on Sections 5-1 to 5-3 on Tuesday, December 23rd!!!!