Download

1 / 29
330 likes | 489 Views
IED Semester test. Mr. Wax Meridian Joint School District No 2 1/11/2013. Design Process 6 steps. List the 6 steps of the design process. Identify the problem Generate concepts Develop a solution Construct and test a prototype Evaluate the solution Present the solution.

E N D
IED Semester test Mr. Wax Meridian Joint School District No 2 1/11/2013
Design Process 6 steps • List the 6 steps of the design process. • Identify the problem • Generate concepts • Develop a solution • Construct and test a prototype • Evaluate the solution • Present the solution
More on the design process • What is a design brief? • A short document that tells everyone • Problem statement (what is the problem) • Design statement (what you are going to do) • Customer • Constraints • Deliverables • When is it written? • As part of step one, Identify the problem.
Still more on the design process • What are criteria? • Goals for the project • What are constraints? • Limits on the project • What are deliverables? • What you must “deliver” to the customer.
Engineer’s Notebook • What is an engineers notebook? • A permanent record of everything the engineer does on a project. • What are the rules of a notebook? • List them all • What is a Portfolio> • A record that demonstrates to others what you have learned, what you can do.
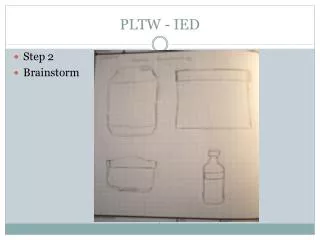
Brainstorming • What is the purpose of Brainstorming? • Create as many ideas as possible in a short amount of time. • What are the rules? • No Criticizing • Go for quantity • Welcome piling on • Have fun, welcome wild ideas • Write them all down
S.I. Unit prefixes • What does SI stand for? (not a magazine) • System international • Convert .24 km to m. • 240 m. • Convert 1250 µg to mg • 1.25 mg • Convert 12 kg to Mg • .012 Mg
Unit Conversion • What does SI stand for? (not a magazine) • System international • Convert .24 km to m. • 240 m. • Convert 1250 µg to mg • 1.25 mg • Convert 12 kg to Mg • .012 Mg
Conversion of Units – SI System • Prefixes indicate the power of 10 • Conversion Factor • Given unit in denominator, desired unit in numerator • Grams to micrograms: 10-6 g = 1 µg or Desired Unit Given Unit
Conversion of Units – U S System Example: Convert 17.2 yards to feet · = 51.6 ft 1 yd = 3 ft Note: Technically, the number of significant digits should remain the same after conversion.
Drawings • What type of drawing is this? • Oblique • What are the three main types o of oblique drawing? • Cavalier, Cabinet and general • What is the proper angle between the depth line and a horizontal line? • 30°, 45°, or 60° are preferred, but any are acceptable
Drawing 2 • What type of drawing is this? • Isometric • What is the proper angle the depth lines make with the horizon? • ALWAYS 30° • What is the scale relationship between the height and the width? • 1:1
Drawing 3 • What type of drawing is this? • Orthographic • How many view do you need? • That depends
Drawing 4 • What type of drawing is this? • Two point perspective. • How do you know that? • From it shrinking to two points in the distance. • What is the name of the two points? • Vanishing points.
Construction Line • Very lightly drawn lines to guide drawing other lines and shapes What is this line called?
Object Line • Thick and dark • Define the object What is this line called? What is this line called?
Hidden Line • Show interior detail not visible from the outside of the part What is this line called? What is this line called?
Center Line • Define the center of arcs, circles, or symmetrical parts • Half as thick as an object line What is this line called? What is this line called?
Dimension Line • Shows distance • Arrows drawn on ends to show where dimension line starts and ends • Actual distance is typically located in middle of this line to display distance What is this line called? What is this line called?
Extension Line • Shows where a dimension starts and stops • Used with dimension lines • Line is 1/16” away from part to avoid confusion with object lines What is this line called? What is this line called?
Leader Line • Show dimensions of arcs, circles and detail What is this line called? What is this line called?
Precedence of Lines • Complex object sketches may require different line types to overlap • Line precedence must be used • Rules that govern line precedence in sketches and technical drawings • Object lines take precedence over hidden and center lines • Hidden lines take precedence over center lines • Cutting plane lines take precedence over all others
Rules for Choosing a Front View Recommendations for how to select the front view • Most natural position or use • Shows best shape and characteristic contours • Longest dimensions • Fewest hidden lines • Best side and top views
Number of Orthographic Projections One View • Uniform thickness or shape • Two views would be identical • All dimensions properly and easily shown on one view
Number of Orthographic Projections Two Views • Symmetrical part • A third view would be identical to one other • Second view is necessary for depth
Summary Statistics Central Tendency • “Center” of a distribution • Mean, median, mode Variation • Spread of values around the center • Range, standard deviation, interquartile range Distribution • Summary of the frequency of values • Frequency tables, histograms, normal distribution
More Statistics • The mean is the sum of the values of a set of data divided by the number of values in that data set. • The most frequently occurring value in a set of data is the mode • Bimodal Data Set: Two numbers of equal frequency stand out • Multimodal Data Set: If more than two numbers of equal frequency stand out • The median is the value that occurs in the middle of a set of data that has been arranged in numerical order. • If an even number in the data set, take the mean of the two center values
Still More • The range is the difference between the largest and smallest values that occur in a set of data. • The standard deviation is a measure of the spread of data values. • A larger standard deviation indicates a wider spread in data values
Normal Distribution Distribution If the data are normally distributed: • 68%of the observations fall within 1 standard deviation of the mean. • 95%of the observations fall within 2 standard deviationsof the mean. • 99.7%of the observations fall within 3 standard deviationsof the mean.