Download

1 / 22
220 likes | 356 Views
Lena Guo Jon Heroux Sudhir Nair. The Aggregate Demand of Housing in the US. Introduction. Home ownership has always been the American dream There are many factors which affect the demand for housing in the United States

E N D
Lena Guo Jon Heroux Sudhir Nair The Aggregate Demand of Housing in the US
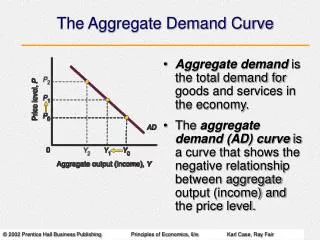
Introduction • Home ownership has always been the American dream • There are many factors which affect the demand for housing in the United States • Housing markets have historically gone through boom and bust cycles over the past several decades • This study uses annual data for the United States from 1980 to 2011 to find the determinants of home prices
Objective • To develop an econometric model to determine which market variables explain aggregate demand for housing in the United States. • H0: Aggregate demand for housing is influenced by various market conditions
Methodology Software: WinORS™ used to calculate best model: • Entered time series data into spreadsheet from 1980 - 2011 • Stepwise regression used to remove variables deemed not significant • Ordinary least squares used (using Ten Basic steps) to continually eliminate variables based on p-value (>0.05) & VIF (>10) and to test data for autocorrelation, multicollinearity, homoscedasticity, and normality • Attempted to force House Price Index and CPI while working through OLS • Further tested the model using Zero intercept as well as Multiplicative model to find the best solution
Included Variables • Dependent variable: Total Housing Inventory
Excluded Variables • US Annual GDP • US Population • US Unemployment Rate • Vacancy Rate • Vacancy Rate 1 Unit • Vacancy Rate 2+ Units • Vacancy Rate 5+ Units • Average # Persons/Household • Consumer Price Index • Dow Jones Industrial Average • Inflation Rate • Median Asking Rent • Personal Income
Model • True demand model • Q= 109443.465 + 86.15 P -18030.993 FRM Q= total housing inventoryP= housing price index FRM= 30-year fixed rate mortgage
Multicollinearity • First of 4 assumptions of regression: absence of collinearity • The independent variables are not correlated • Confirmed by variance inflation factor less than 10, ideally less than 5 • Removed all variables one-by-one with VIF >10 • Average VIF= 2.963
Autocorrelation • Durbin: 1.237 • Durbin H: n/c • H0: Rho=0 • Rho: Pos & Neg Reject • Rho: Pos Do not reject • Rho: Neg Reject • Ideal value for Durbin is 2.0 and do not reject H0 • Attempted to remove autocorrelation • First differences • Durbin-adjusted method • Model dissipated in both cases
Constant Variance • White’s test: 23.835 • P-value: 0.00023 reject • Determines homoscedascity • Ideal value is > 0.05 and do not reject • Attempted to correct with weighted OLS file • Did not improve model • Continued with original model
Normality • Correlation for Normality: 0.9708 • Approx Critical Value: 0.0720 • Ideal is correlation value > critical value • Confirmed normal: follows and hugs line
R-squared • R-squared: 94.384% • Shows great explanatory power from the independent variables • Measures proportion of variation in dependent variable about its mean explained by variance in independent variables • Adjusted R-squared: 93.997% • Remains high and in acceptable range
F-statistic • F-value: 243.699 p-value: 0.00001 • Ratio of explained variation:unexplained variation • Result indicates a statistically significant proportion of total variation in dependent variable is explained • P-value is probability of rejecting null hypothesis, confidence level of 99.99%
Elasticities • Estimates elasticity of independent variables against the dependent variable • A negative value implies an elastic relationship and a positive value implies inelastic relationship
Conclusions • Tested the model with both linear additive as well as multiplicative model, however results were similar • Not able to conclude with this model that the aggregate demand of housing in US is determined by the 15 market variables tested during the time period of 1980-2011 • A key observation was the high relationship 30-year fixed mortgage has to the housing inventory • During all the various test runs, 30 year FMR was in the final 2 results • Leads us to the conclusion (despite reject of Rho) that there is an inherent relationship between 30-year FMR and the housing demand • Rate of interest does seem to have an inherent relationship with the aggregate housing demand, compared to other independent variables.
Conclusions • 30 year FMR has an elastic relationship with the housing inventory levels, while Housing Price Index has a inelastic relationship with the housing inventory levels • These results make sense, when the interest rates go down, the housing inventory levels go down, which means the demand has increased • Likewise when the Housing Price index goes up, the inventory levels also go up, meaning the housing demand goes down. • Note: This was an exploratory study to develop an econometric model to determine which market variables explain aggregate demand for housing in the United States.
References • Professor Gordon Dash’s Lecture Notes and website - http://www.ghdash.net/ • WinOrs Software and WinOrs Help files. • Aggregate demand of Housing in US.http://research.stlouisfed.org/fred2/series/DJIA/downloaddata?cid=32255http://research.stlouisfed.org/fred2/series/UNRATE/downloaddata • US Annual gdphttp://wikiposit.org/w?filter=Economics/MeasuringWorth.com/GDP/ • US Rate of inflationhttp://inflationdata.com/Inflation/Inflation_Rate/CurrentInflation.asp • Consumer Price Indexftp://ftp.bls.gov/pub/special.requests/cpi/cpiai.txt • 30 Yr Conventional Mortgage Ratehttp://research.stlouisfed.org/fred2/series/WRMORTG/downloaddata • Total Housing Inventory http://www.census.gov/compendia/statab/2012/tables/12s0982.pdf • Modeling the U.S. housing bubble: an econometric analysisby Jonathan Kohn and Sarah K. Bryanthttp://www.aabri.com/manuscripts/09381.pdf