Download
1 / 33
330 likes | 441 Views
Wind Energy: Technology, Markets, Economics and Stakeholders. Larry Flowers NREL 09 December 2002 Boone, NC. Sizes and Applications. Small ( 10 kW) Homes Farms Remote Applications (e.g. water pumping, telecom sites, icemaking). Intermediate (1 0-250 kW) Village Power

E N D
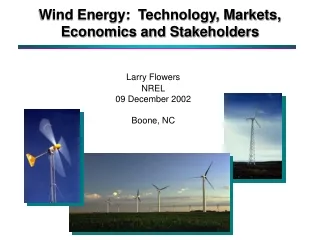
Wind Energy: Technology, Markets, Economics and Stakeholders Larry Flowers NREL 09 December 2002 Boone, NC
Sizes and Applications • Small (10 kW) • Homes • Farms • Remote Applications • (e.g. water pumping, telecom sites, icemaking) • Intermediate • (10-250 kW) • Village Power • Hybrid Systems • Distributed Power • Large (250 kW - 2+MW) • Central Station Wind Farms • Distributed Power
Small Wind Turbines are Different • Large Turbines (600-1800 kW) • Installed in Windfarms, 10 - 100 MW • Provide Low Cost Power to the Grid • < $1,000/kW • Require 6 m/s (13 mph) Average Wind Speeds • Small Turbines (0.3-50 kW) • Installed Off-Grid or at On-Grid Facilities • $2,000-6,000/kW • Designed for Reliability / Low Maintenance • Require 4 m/s (9 mph) Average 1,500 kW Wind Turbine 10 kW Wind Turbine
Incentives Make Small Wind SystemsMore Economical 12 mph is class 3 wind power 14 mph is class 5 wind power
Residential Small Wind Incentives Tax Incentives Buydown* May 1, 2002 Net Metering Only Local Option Tax Incentives** Tax Incentives & Buydown *Contact your utility to see if you qualify for the Renewable Energy Resources Program. ** Contact your city or county to see if they offer tax incentives for small wind systems. Net Metering & Buydown Tax Incentives, Net Metering & Buydown Tax Incentives & Net Metering Net Metering & Local Option Tax Incentives**
Growth of Wind Energy Capacity Worldwide Actual Projected Jan 2002 Cumulative MW Rest of World = 2,365 North America = 4,543 Europe = 16,362 Rest of World Rest of World North America North America Europe Europe MW Installed Year Sources: BTM Consult Aps, March 2001 Windpower Monthly, January 2002
Maturing Wind Technology • Technology has matured over 25 years of learning experiences • Availabilities reported of 98-99% • Certification to international standards helps to avoid “show stoppers” • Performance and cost have dramatically improved • New hardware is being developed on multiple fronts: • higher productivity and lower costs • larger sized for both land and off-shore installations • tailored designs for high capacity factor, low wind speed and extreme weather conditions
Drivers for Wind Power • Declining Wind Costs • Fuel Price Uncertainty • Federal and State Policies • Economic Development • Green Power • Energy Security
“You don’t have to be a utility commissioner to see that we need better regulatory policies to achieve the diversity, economic development, and environmental benefits of wind power.” Bob Anderson, Montana Public Service Commission, Helena, Montana
Wind Economics - Determining Factors • Wind Resource • Financing and Ownership Structure • Taxes and Policy Incentives • Plant Size: equipment, installation and O&M economies of scale • Turbine size, model, and tower height • Green field or site expansion • What is included: land, transmission, ancillary services
Cost of Energy Trend 1979: 40 cents/kWh 2000: 4 - 6 cents/kWh • Increased Turbine Size • R&D Advances • Manufacturing Improvements NSP 107 MW Lake Benton wind farm 4 cents/kWh (unsubsidized) 2004: 3 – 4.5 cents/kWh
Wind Cost of Energy 12 10 8 Low wind speed sites COE (¢/kWh [constant 2000 $]) 6 Bulk Power Competitive Price Band High windspeed sites 4 2 0 1990 2010 2020 1995 2005 2015 2000
COOP vs. IPP Financing • Larger plants are significantly less expensive per kWh • Public power can own/ install smaller plants at comparable cost to large IPP projects • Aggregation of demand reduces costs
“Wind energy adds diversity to our generation fleet and provides a hedge against fossil fuel price increases. In addition, the development of renewable energy resources is widely supported by the public and our customers.” Rick Walker, director, Renewable Energy Business Development, AEP Energy Services, Inc., Dallas, TX
Recent Developments • The wind industry is delivering ~3 cent/kWh contracts, including PTC for large projects • Several large projects under development • 300 MW Stateline (WA/OR) • 109 MW Utilicorp (KS) • 4>100 MW under development in West Texas • Gas price increases and the power crisis • CO: 162 MW of wind wins all-source bid on economics alone • “wind is the lowest cost resource” • serious consideration of GW (BPA, Austin) • transmission and grid impacts to the forefront • RUS loan to Basin Electric for Green Pricing program in S. Dakota • NPPD RFP for 20 MW
Wind Farm Development: Driving Factors • Wind Resource • Proximity to Transmission Lines/Substations with excess capacity • State Policy Provisions • property/sales tax, • permitting and review, • subsidies and incentives • renewable power purchase mandates • Utility green power programs and customer demand • Federal Policy • renewal of production tax credit • potential purchase mandates
Green Power & Customer Choice • More than 90 utilities in 30 states are offering green pricing programs where customers pay a premium to cover extra cost of renewable energy. • Many utilities are offering green products to meet customer demand and diversify supply portfolio Map from DOE’s Green Power site at www.eren.doe.gov/greenpower
“Our customers wanted this wind program and it was our job to deliver it. It has turned out to be a huge source of community pride. The turbines are a visible landmark showing the Moorhead Community’s commitment to a better world for our children.” Christopher Reed, Moorhead Public Service, Moorhead, Minnesota
“The wind offers energy independence for many Kansas residents. Federal, state, and local governments should work together to provide access to affordable energy choices.” State Representative Tom Sloan, Lawrence, Kansas
None Individual Utilities Investor-Owned Utilities Only, Not Rural Cooperatives Investor-Owned Utilities and Rural Cooperatives Monthly Net Metering Annual Net Metering Varies by Utility or Unknown Net Metering By State 25 kW 25 kW 15/125 kW 100 kW 50 kW 100 kW 40 kW 60 kW 25 kW 20 kW PV Only 100 kW 10 kW 25 kW 25 kW No Limit 10 kW 100 kW No Limit 1,000 kWh/ mo 10 kW 100 kW 25 kW 40 kW 25 kW 10/25 kW 10/25 kW 1 MW 80 kW Solar Only 100 kW, 25,000 kWh/y 100 kW 10 kW 25/100kW 10/100kW 50 kW 10 kW Revised: 2 Apr 02
“It seems only natural for rural utilities to do everything they can to advance both farm-based renewable energy development and rural economic development in a cost-effective way. In my opinion, wind energy is the next great chapter in the rural electrification story.” Aaron Jones, Washington Rural Electric Cooperative Association; Olympia, WA
Economic Development Opportunities • Land Lease Payments: 2-3% of gross revenue $2500-4000/MW/year • Local property tax revenue: 100 MW brings in on the order of $1 million/yr • 1-2 jobs/MW during construction • 2-5 permanent O&M jobs per 50-100 MW, • Local construction and service industry: concrete, towers usually done locally • Investment as Equity Owners: production tax credit, accelerated depreciation • Manufacturing and Assembly plants expanding in U.S. (Micon in IL, LM Glasfiber in ND)
“Wind is a homegrown energy that we can harvest right along side our corn or soybeans or other crops. We can use the energy in our local communities or we can export it to other markets. We need to look carefully at wind energy as a source of economic growth for our region” David Benson, Farmer and County Commissioner, Nobles County, Minnesota
Key Issues for Wind Power • Restructuring and Policy Uncertainty • Transmission: access, RTO formation and rules, new lines • Operational impacts: intermittency, ancillary services, allocation of costs • Siting and Permitting: avian, noise, visual, federal land • Accounting for non-monetary value: green power, no fuel price risk, reduced emissions
“In evaluating the potential of wind energy generation, Native Americans realize that wind power is not only consistent with our cultural values and spiritual beliefs, but can also be a means of achieving Native sustainable homeland economies.” Ronald Neiss, Rosebud Utility Commission President, Rosebud Sioux Reservation, South Dakota