Download
1 / 104
1.04k likes | 1.19k Views
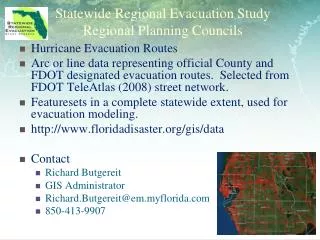
The Transportation Land Use Connection Dutchess County October 19, 2010 Steve Munson NYSDOT Statewide Planning Bureau Mark A. Sargent, P.E Creighton Manning Engineering. NYSDOT Statewide Planning Bureau.

E N D
The Transportation Land Use ConnectionDutchess County October 19, 2010Steve MunsonNYSDOT Statewide Planning BureauMark A. Sargent, P.ECreighton Manning Engineering NYSDOT Statewide Planning Bureau
The Transportation Land Use ConnectionDutchess County October 19, 2010Steve MunsonNYSDOT Statewide Planning BureauMark A. Sargent, P.ECreighton Manning Engineering NYSDOT Statewide Planning Bureau
Presentation Transportation and Land Use TIS Fundamentals Looking to the Future Cases
Land Use and Transportation Are Inextricably Linked The pattern of growth we’ve experienced over the last 60 years has impacts that we now recognize as unsustainable: traffic congestion, environmental degradation, high public and private costs and a diminished quality of life. School Shops Home Workplace Recreation
Conflict Points & Driver Behavior Stop Left Left Left Merge Merge
Capacity per Lane, No Driveways or Intersection Capacity per Lane, with Intersections Capacity per Lane, with Intersections and Driveways @ 1,500 vehicles per hour at Level of Service D @ 1,250 vehicles per hour at Level of Service D @ 900 vehicles per hour at Level of Service D Travel Time & Capacity
Increased use and demand …… and degraded service and safety ….. increases costs
The Cost of Local Roads Between 1996 and 2003 municipal transportation expenditures outside of New York City grew by 30 percent, to $3.1 billion. Transportation costs accounted for 22 percent of total expenditures by towns in 2003. Assessed Value Greater Than $8,000,000
Social Impacts • The average driver spends 17 full days a year behind the wheel; this is more than the average parent spends dressing, bathing and feeding a child, and more than the average American takes for vacation.Source: Surface Transportation Policy Project Traffic congestion is one of the most frequently mentioned factors contributing to aggressive driving. Source: AAA Foundation for Traffic Safety
“Personal” Cost Impacts • Transportation is the second-highest household cost for the average family after housing, exceeding 19.1 percent of total family spending in 2003. Source: Surface Transportation Policy Project • A 5 to 10 percent reduction in traffic speeds can increase residential property values by up to 20 percent. Source: Todd Litman, Victoria Transport Policy Institute, 1999
NYSDOT Development Management Tools • Highway Work Permit • Purchase of Access Control • Medians
NYSDOT Capital Tools • Turn Lanes • Signals & Signal Mgmt. • Roundabouts • Through Lanes • Medians • Access Retrofits • Pedestrian & Bike Facilities • Demand Management • Speed Limits • We don’t undertake projects to resolve the impacts of cumulative development until the problems are severe • The intensity and pattern of development limits our options and increases their cost • Our solutions involve significant trade-offs
The Role of Municipalities is Greater • Comprehensive Plan • Zoning Map & Regulations • Site Plan & Subdivision Approval • SEQRA and GEIS Actions • (Local) System planning and expansion • Municipalities have the dominant role in minimizing the adverse impacts of development • Municipalities have the dominant role in determining whether growth meets their overall objectives
Presentation Transportation and Land Use TIS Fundamentals Looking to the Future Cases
Decision Making The Place as it is Transportation Planning Land Use Planning Decisions / Actions
Roger Creighton “....all these actions ought to be planned together for the good of society. In particular, there needs to be close coordination between the two fields of transportation planning and land use planning”
Traffic Impact Study Guidelines • Purpose and Overview • Initiating Transportation Impact Studies • Context and Framework • Non-Site Traffic Forecast • Site Traffic Generation • Site Traffic Distribution and Assignment • Analysis • Site Access and Off-Site Improvements • On-Site Planning and Parking Principles • Report
Purpose “Provide a credible basis for estimating transportation improvement requirements attributable to a particular project”
Problems/Challenges - Technical • Study Area • Narrow rural roads • Geometric conditions • Trip Generation • Peak hours • Seasonal factors • Peak hour factors • Heavy vehicle percentages • Signal phasing
Problems/Challenges - General • Misconceptions / Expectations • Inadequate scoping • Auto focus • Lack of Vision • Lack of Coordination • Political barriers • Developer resistance • Education and Training • Missed opportunities
Traffic Impact Study Fundamentals Development Plan Scoping & Data Collection Forecasting Analysis Acceptable? No Yes Permitting
Traffic Impact Fundamentals Development Plan Scoping & Data Collection Forecasting Analysis Acceptable? No Yes Permitting
Existing Conditions • Facilities • Volumes • Vehicle Class • Speeds • Pedestrians • Lane geometry • Widths • Traffic control • Sight Distances
Traffic Impact Study Development Plan Scoping & Data Collection Forecasting Analysis Acceptable? No Yes Permitting
ITE Trip Generation Research • Development Size • Density – dwellings, jobs per acre • Diversity – Mix of housing, jobs, retail • Design – connectivity, walkability • Destinations – regional accessibility • Distance to Transit – rail, bus proximity • Demographics – household size, income
Case Study - Two NC Neighborhoods Comparable total trips overall (+ 10 Percent) Comparable time spent traveling Fewer miles traveled 13 percent fewer auto trips More than 2 times as many walking trips 24 percent fewer external trips Land use can affect transportation Source: Travel behavior in neo-traditional neighborhood developments: A case study in USA, Asad J. Khattak, Daniel Rodriguea; Carolina Transportation Program, Department of City and Regional Planning, University of North Carolina, Chapel Hill, NC
Traffic Impact Fundamentals Development Plan Scoping & Data Collection Forecasting Analysis Acceptable? No Yes Permitting
Standard Methodologies • Signalized Intersections • Unsignalized Intersections • Roundabouts • Urban Streets • Pedestrians • Bicycles • Two-Lane Highways • Multilane Highways • Freeway Facilities • Ramps • Transit
Unsignalized (Delay seconds/vehicle) Signalized (Delay seconds/vehicle) LOS 0 to 10 10 to 20 20 to 35 35 to 55 55 to 80 >80 A (Little or No Delay) B (Short Traffic Delay) C (Average Traffic Delay) D (Long Traffic Delay) E (Very Long Traffic Delay) F (Delay Unacceptable to Drivers) 0 to 10 10 to 15 15 to 25 25 to 35 35 to 50 >50 What is Level of Service? Level of Service Criteria (for Intersections) based on the 2000 Highway Capacity Manual
Delay (seconds per vehicle) Mitigation
Access Design Objectives • Design for peak hour volumes • Preserve roadway function • Minimize speed differential • Minimize lane encroachment • Consider driveway width and radii • Provide adequate sight distance • Provide sufficient storage • Provide positive driver guidance • Minimize conflict points
Mitigation • Add a lane • Add traffic signal • Build roundabout • Shoulder widening • Channelize • Ensure adequate storage • Realign approach • Improve sight distance • Modify signal phasing • Other Access Management