Download
1 / 64
640 likes | 899 Views
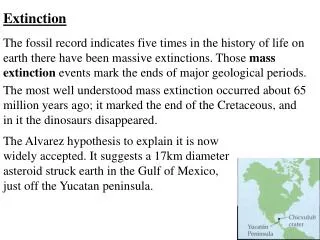
Chapter 3 Extinction. © 2002 by Prentice Hall, Inc. Upper Saddle River, NJ 07458. Outline. Rate of extinction Causes of extinction Risks confronted by endangered species Characteristics of species and their relationship to extinction. The Extinction Crisis. Extinction

E N D
Chapter 3Extinction © 2002 by Prentice Hall, Inc. Upper Saddle River, NJ 07458
Chapt. 03 Outline • Rate of extinction • Causes of extinction • Risks confronted by endangered species • Characteristics of species and their relationship to extinction
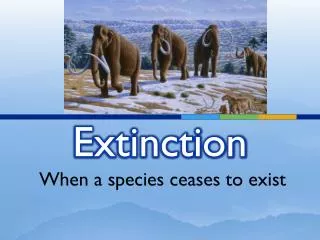
Chapt. 03 The Extinction Crisis • Extinction • All individuals die without producing progeny • Pseudoextinction • Species disappear over evolutionary time
Chapt. 03 The Extinction Crisis • Pseudoextinction • Lineage transformed into separate lineages • Fossil Record • Extinct species to living species – 1,000:1
Chapt. 03 Extinction Crisis (cont.) • Fossil Record (cont.). • Average life span of a species – 4 million years • Average extinction rate – 2.5 species per year
Chapt. 03 Extinction Crisis • Fossil Record • Total number of species over time – 10 million • Biased fossil record • Favors successful, geographically wide-ranging species • Persist longer than the average
Chapt. 03 Extinction Crisis • Biased fossil record (cont.) • Biased toward vertebrates and mollusks • Background extinction rates are probably higher than indicated in fossil record. • Example Extinction rates 10 times higher than predicted by fossil record
Chapt. 03 Extinction Crisis • Background extinction rates are probably higher than indicated in fossil record (cont.). • 1 every 50 years for birds living today
Chapt. 03 Extintion Crisis • Present extinction rate much high than in the past or predicted. • Effects due to humans – Distant Past • Correlation between human population growth and the number of extinctions (Figure 3.1)
Chapt. 03 6 5 50 4 Birds 40 Mammals Number of humans (billions) 3 Number of extinct species 30 2 20 1 10 0 0 1650 1700 1750 1800 1850 1900 1950 2000 1600-1700 1700-1800 1800-1900 1900-2000 Year Year
Chapt. 03 Extinction Crisis • Effects due to humans (cont.). • Large scale extinctions in North and South America coinciding with the arrival of humans (11 thousand years ago) • North America lost 73% of its genera of large mammals
Chapt. 03 Extinction Crisis • Effects due to humans (cont.). • Large scale extinctions in North and South America (cont.). • South America lost 80% of its genera of large mammals
Chapt. 03 Extinction Crisis (cont.) • Effects due to humans (cont.). • Large scale extinctions in Australia coinciding with the arrival of humans (13 thousand years ago) • Lost nearly all of its large mammals, giant snakes, and reptiles • Nearly half of its large flightless birds
Chapt. 03 Extinction Crisis (cont.) • Probable causes of these extinctions • Hunting • Some climate change
Chapt. 03 Extinction Crisis • Effects due to humans – Recent Past • Devastating effects on islands • Hawaii – 4th and 5th century Polynesians arrived • Exterminated 50 out of 100 species of endemic land birds.
Chapt. 03 Extinction Crisis • Devastating effects on islands (cont.) • New Zealand – End of the 18th century • Entire avian megafauna consisting of huge land birds was exterminated • Accomplished through hunting and habitat destruction
Chapt. 03 Extinction Crisis • Devastating effects on islands (cont.) • Madagascar – last 1,500 years • Exterminated • Giant elephant bird, largest bird ever recorded • 20 species of lemur, most larger than any surviving species • 2 giant land tortoises
Chapt. 03 Patterns of Extinction • Islands vs. continental areas (Table 3.1)
Chapt. 03 Patterns of Extinction • Reasons for differences in extinction rate • Island species may consist of a single population • Single climatic event can lead to extinction
Chapt. 03 Patterns of Extinction • Reasons for differences in extinction rate (cont.) • Island species may have evolved in the absence of terrestrial predators • Characteristics contributing to extinction • Flightlessness • Tameness • Reduced reproductive rates • Ex. Hawaii (Figure 3.2)
100 Habitat loss Exotic species 75 Pollution Hunting 50 Percent endangered Disease 25 0 Hawaiian Birds Continental U.S. plants Hawaiian plants Continental U.S. birds
Chapt. 03 Patterns of Extinction • Causes of extinction (Figure 3.3)
Chapt. 03 No cause assigned 56% 17% Introduced animals Habitat destruction 16% Hunting 10% 1% Other causes
Chapt. 03 Patterns of Extinction • Introduced species effects • Competition • Not been shown to eliminate an entire species • Predation • Rats, cats, and mongooses have accounted for at least 112 of 258 extinctions of birds on islands (43%).
Chapt. 03 Patterns of Extinction • Introduced species effects (cont.) • Disease and parasitism • Avain malaria in Hawaii accounted for the loss of 50% of the local Hawaiian bird species
Chapt. 03 Patterns of Extinction • Causes of Extinction (Cont.) • Habitat destruction • A prime cause of extinction • Ex. Deforestation • Subtle alterations (e.g. pollution) have not yet been shown to cause extinction • Direct exploitation – Hunting • Caused numerous extinctions • Ex. Figure 3.4
Chapt. 03 Endangered Species • Definition – a species that is thought to be at risk of extinction in the foreseeable future. • Factors threatening species with Extinction • Habitat loss or modification
Chapt. 03 Endangered Species • Factors threatening species with Extinction (cont.). • Hunting • Accidental or deliberate introduction of exotic species • Deliberate eradication
Chapt. 03 Endangered Species • Factors threatening species with Extinction (cont.). • Incidental • Disease, both exotic and endemic
Chapt. 03 Endangered Species • Characteristics of Factors • Human in origin • Species are threatened with several factors simultaneously • Relative importance as measured by frequency of occurrence
Chapt. 03 Endangered Species • Characteristics of Factors (cont.) • Ex. Threats facing terrestrial mammals in Australia and the Americas • 119 species considered endangered • 75% threatened by more than one factor • 27 species face four or more threats • Major threat – 76% of the species are experiencing habitat loss or modification • Figure 3.5
Threat and classes of threats Percent of species affected 0 10 20 30 40 50 60 Habitat loss & modification: 76% Cultivation & settlement Pastoral development Logging & plantations Other Exploitation: 50% Meat Fur and hides Live trade Introductions: 18% Predators Competitors Others Limited distribution Persecution Disturbance Incidental take Disease
Chapt. 03 Endangered Species • Significance of hunting – Valuable fur and wood (Figure 3.6) • Overexploitation • Overharvesting for commercial interests
Chapt. 03 Endangered Species • Overexploitation (cont.). 1998, • Rare plants are threatened by collectors • David Wilcove categorized threats to plants and animals in the US • Five categories
Chapt. 03 Endangered Species • Five categories (cont.) • Habitat destruction • Alien species • Overharvesting • Disease (both native and alien) • Pollution
Chapt. 03 Endangered Species • Sample size: 1880 species • Results (Figure 3.7)
Percent of species threatened 0 10 20 30 40 50 60 70 80 90 100 All species Vertebrates Invertebrates Plants Mammals Birds Reptiles Amphibians Fish Freshwater mussels Butterflies Other invertebrates Habitat loss Exotic species Pollution Over exploitation Disease
Chapt. 03 Endangered Species • Categorization of threats by class of species (Figure 3.8)
Chapt. 03 Percentage endangered 1 1.5 2 2.5 3 3.5 0 0.5 Mammals Fish Birds Reptiles Amphibians All invertebrates
Chapt. 03 Endangered Species • Categorization of threats by geographic areas (Table 3.2)
Chapt. 03 Endangered Species • The majority of threatened mammals occur in tropical countries • Tropical countries have more species (therefore should have more endangered species • Tropical countries have a higher percentage of endangered species as well.
Chapt. 03 Endangered Species (cont.) • Bigger countries have more endangered species than smaller countries (Figure 3.9)
Chapt. 03 60 55 Madagascar Indonesia 50 45 Brazil India 40 China Australia Number of threatened mammals 35 Tanzania Zaire 30 Peru United States Vietnam Cameroon Colombia 25 Mexico Thailand South Africa Nigeria Laos Argentina 20 10,000 20,000 50,000 100,000 500,000 1,000,000 2,000,000 200,000 Country area (1000 ha)
Chapt. 03 Endangered Species (cont.) • US and endangered reptiles, amphibians, and fishes • Better monitoring and documenting activities
Chapt. 03 Endangered Species • Correlations between human factors and extinction • 1995, Kerr and Currie Compared 90 countries • Six indices of human activities (Table 3.3)
Chapt. 03 Endangered Species (cont.) • Correlation between human factors and extinction (cont.) • Human population explained the most variation in the proportion of endangered species of birds. • Per capita GNP explained the most variation in mammals
Chapt. 03 Species Characteristics and Extinction • Rarity (Fig. 3.10) • Determined by • Geographic range, • Breadth of habitat • Local population size • Ability to disperse (Fig. 3.10)