Recent Advances in the TAU Performance System
510 likes | 680 Views
Recent Advances in the TAU Performance System. Sameer Shende, Allen D. Malony {sameer, malony}@cs.uoregon.edu Department of Computer and Information Science Computational Science Institute University of Oregon. Outline. Introduction to TAU and PDT New features Instrumentation CCA

Recent Advances in the TAU Performance System
E N D
Presentation Transcript
Recent Advances in the TAU Performance System Sameer Shende, Allen D. Malony {sameer, malony}@cs.uoregon.edu Department of Computer and Information Science Computational Science Institute University of Oregon
Outline • Introduction to TAU and PDT • New features • Instrumentation • CCA • Integration of Uintah and TAU • Performance Monitoring Framework • Performance Tracking and Reporting: XPARE • Performance Database Framework • Work in Progress • Conclusions
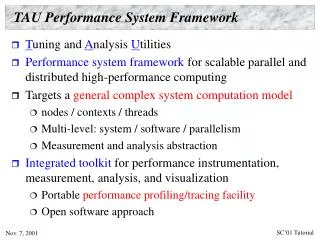
TAU Performance System Framework • Tuning and Analysis Utilities • Performance system framework for scalable parallel and distributed high-performance computing • Targets a general complex system computation model • nodes / contexts / threads • Multi-level: system / software / parallelism • Measurement and analysis abstraction • Integrated toolkit for performance instrumentation, measurement, analysis, and visualization • Portable, configurable performance profiling/tracing facility • Open software approach • University of Oregon, LANL, FZJ Germany • http://www.cs.uoregon.edu/research/paracomp/tau
TAU Performance System Architecture Paraver EPILOG
Program Database Toolkit (PDT) • Program code analysis framework for developing source-based tools • High-level interface to source code information • Integrated toolkit for source code parsing, database creation, and database query • commercial grade front end parsers • portable IL analyzer, database format, and access API • open software approach for tool development • Target and integrate multiple source languages • Use in TAU to build automated performance instrumentation tools
PDT Architecture and Tools C/C++ Fortran 77/90
New Features in TAU • Instrumentation • OPARI – OpenMP directive rewriting approach [POMP, FZJ] • Selective instrumentation –grouping, include/exclude lists • tau_reduce – rule based detection of high overhead lightweight routines • CCA: TAU component interface • Measurement • PAPI [UTK] – Support for multiple hardware counters/time • Callpath profiling (1-level) • Native generation of EPILOG traces [EXPERT, FZJ] • Analysis • Support for Paraver [CEPBA] trace visualizer • jracy – New Java based profile browser in TAU • Availability • Support for new platforms and compilers (NEC, Hitachi, Intel…)
Instrumentation Control • Selection of which performance events to observe • Could depend on scope, type, level of interest • Could depend on instrumentation overhead • How is selection supported in instrumentation system? • No choice • Include / exclude lists (TAU) • Environment variables • Static vs. dynamic • Problem: Controlling instrumentation of small routines • High relative measurement overhead • Significant intrusion and possible perturbation
Instrumentation Control: Grouping • Profile Groups • A group of related routines forms a profile group • Statically defined • TAU_DEFAULT, TAU_USER[1-5], TAU_MESSAGE, TAU_IO, … • Dynamically defined • Group name based on string “integrator”, “particles” • Runtime lookup in a map to get unique group identifier • tau_instrumentor file.pdb file.cpp –o file.i.cpp -g “particles” • Assigns all routines in file.cpp to group “particles” • Ability to change group names at runtime • Instrumentation control based on profile groups
TAU Instrumentation Control API • Enabling Profile Groups • TAU_ENABLE_INSTRUMENTATION(); // Global control • TAU_ENABLE_GROUP(TAU_GROUP); // statically defined • TAU_ENABLE_GROUP_NAME(“group name”); // dynamic • TAU_ENABLE_ALL_GROUPS(); // for all groups • Disabling Profile Groups • TAU_DISABLE_INSTRUMENTATION(); • TAU_DISABLE_GROUP(TAU_GROUP); • TAU_DISABLE_GROUP_NAME(); • TAU_DISABLE_ALL_GROUPS(); • Obtaining Profile Group Identifier • TAU_GET_PROFILE_GROUP(“group name”); • Runtime Switching of Profile Groups • TAU_PROFILE_SET_GROUP(TAU_GROUP); • TAU_PROFILE_SET_GROUP_NAME(“group name”);
TAU Pre-execution Instrumentation Control • Dynamic groups defined at file scope • Group names and group associations may be modified at runtime • Controlling groups at pre-execution time using --profile <group1+group2+…+groupN> option % tau_instrumentor app.pdb app.cpp –o app.i.cpp –g “particles” % mpirun –np 4 application –profile particles+field+mesh+io • Enables instrumentation for TAU_DEFAULT and particles, field, mesh and io groups. • Examples: • POOMA v1 (LANL) • Static groups used • VTF (ASAP Caltech) • Dynamic execution instrumentation control by python based controller
Selective Instrumentation: Include/Exclude Lists % tau_instrumentor Usage : tau_instrumentor <pdbfile> <sourcefile> [-o <outputfile>] [-noinline] [-g groupname] [-i headerfile] [-c|-c++|-fortran] [-f <instr_req_file> ] For selective instrumentation, use –f option % cat selective.dat # Selective instrumentation: Specify an exclude/include list. BEGIN_EXCLUDE_LIST void quicksort(int *, int, int) void sort_5elements(int *) void interchange(int *, int *) END_EXCLUDE_LIST # If an include list is specified, the routines in the list will be the only # routines that are instrumented. # To specify an include list (a list of routines that will be instrumented) # remove the leading # to uncomment the following lines #BEGIN_INCLUDE_LIST #int main(int, char **) #int select_ #END_INCLUDE_LIST
Rule-Based Overhead Analysis (N. Trebon, UO) • Analyze the performance data to determine events with high (relative) overhead performance measurements • Create a select list for excluding those events • Rule grammar (used in tau_reduce tool) [GroupName:]Field Operator Number • GroupName indicates rule applies to events in group • Field is a event metric attribute (from profile statistics) • numcalls, numsubs, percent, usec, cumusec, count [PAPI], totalcount, stdev, usecs/call, counts/call • Operator is one of >, <, or = • Number is any number • Compound rules possible using & between simple rules
Example Rules • #Exclude all events that are members of TAU_USER #and use less than 1000 microsecondsTAU_USER:usec < 1000 • #Exclude all events that have less than 100 #microseconds and are called only onceusec < 1000 & numcalls = 1 • #Exclude all events that have less than 1000 usecs per #call OR have a (total inclusive) percent less than 5usecs/call < 1000percent < 5 • Scientific notation can be used • usec>1000 & numcalls>400000 & usecs/call<30 & percent>25
CCA: Extended Component Design • PKC: Performance Knowledge Component • POC: Performance Observability Component genericcomponent
Timer Event Control Query Design of Performance Observation Component • One performance component per context • Performance component provides a Measurement Port • Measurement Port allows a user to create and access: • Timer (start/stop, set name/type/group) • Event (trigger) • Control (enable/disable groups) • Query (get functions, metrics, counters, dump to disk) Performance Component Measurement Port
Measurement Port in CCAFEINE namespace performance { namespace ccaports { class Measurement: public virtual classic::gov::cca::Port { public: virtual ~ Measurement (){} /* Create a Timer */ virtual performance::Timer* createTimer(void) = 0; virtual performance::Timer* createTimer(string name) = 0; virtual performance::Timer* createTimer(string name, string type) = 0; virtual performance::Timer* createTimer(string name, string type, string group) = 0; /* Create a Query interface */ virtual performance::Query* createQuery(void) = 0; /* Create a User Defined Event interface */ virtual performance::Event* createEvent(void) = 0; virtual performance::Event* createEvent(string name) = 0; /** * Create a Control interface for selectively enabling and disabling * the instrumentation based on groups */ virtual performance::Control* createControl(void) = 0; }; }
Timer Class Interface namespace performance { class Timer { public: virtual ~Timer() {} /* Start the Timer. Implement these methods in * a derived class to provide required functionality. */ virtual void start(void) = 0; /* Stop the Timer.*/ virtual void stop(void) = 0; virtual void setName(string name) = 0; virtual string getName(void) = 0; virtual void setType(string name) = 0; virtual string getType(void) = 0; /**Set the group name associated with the Timer * (e.g., All MPI calls can be grouped into an "MPI" group)*/ virtual void setGroupName(string name) = 0; virtual string getGroupName(void) = 0; virtual void setGroupId(unsigned long group ) = 0; virtual unsigned long getGroupId(void) = 0; }; }
Control Class Interface namespace performance { class Control { public: ~Control () { } /* Control instrumentation. Enable group Id.*/ virtual void enableGroupId(unsigned long id) = 0; /* Control instrumentation. Disable group Id. */ virtual void disableGroupId(unsigned long id) = 0; /* Control instrumentation. Enable group name. */ virtual void enableGroupName(string name) = 0; /* Control instrumentation. Disable group name.*/ virtual void disableGroupName(string name) = 0; /* Control instrumentation. Enable all groups.*/ virtual void enableAllGroups(void) = 0; /* Control instrumentation. Disable all groups.*/ virtual void disableAllGroups(void) = 0; };}
Query Class Interface namespace performance { class Query { public: virtual ~Query() {} /* Get the list of Timer names */ virtual void getTimerNames(const char **& functionList, int& numFuncs) = 0; /* Get the list of Counter names */ virtual void getCounterNames(const char **& counterList, int& numCounters) = 0; /* getTimerData. Returns lists of metrics.*/ virtual void getTimerData(const char **& inTimerList, int numTimers, double **& counterExclusive, double **& counterInclusive, int*& numCalls, int*& numChildCalls, const char **& counterNames, int& numCounters) = 0; virtual void dumpProfileData(void) = 0; virtual void dumpProfileDataIncremental(void) = 0; // timestamped dump virtual void dumpTimerNames(void) = 0; virtual void dumpTimerData(const char **& inTimerList, int numTimers) = 0; virtual void dumpTimerDataIncremental(const char **& inTimerList, int numTimers) = 0; }; }
Measurement Port Implementation • TAU component implements the MeasurementPort • Implements Timer, Control, Query and Control classes • Registers the port with the CCAFEINE framework • Components target the generic MeasurementPort interface • Runtime selection of TAU component during execution • Instrumentation code independent of underlying tool • Instrumentation code independent of measurement choice • TauMeasurement_CCA port implementation uses a specific TAU measurement library
Using MeasurementPort #include "ports/Measurement_CCA.h"… double MonteCarloIntegrator::integrate (double lowBound, double upBound,int count) { classic::gov::cca::Port * port;double sum = 0.0; // Get Measurement port port = frameworkServices->getPort ("MeasurementPort"); if (port) measurement_m = dynamic_cast < performance::ccaports::Measurement * >(port); if (measurement_m == 0){ cerr << "Connected to something other than a Measurement port"; return -1; } static performance::Timer* t = measurement_m->createTimer( string("IntegrateTimer")); t->start(); for (int i = 0; i < count; i++) { double x = random_m->getRandomNumber (); sum = sum + function_m->evaluate (x); } t->stop();
Using TAU Component in CCAFEINE repository get TauMeasurement repository get Driver repository get MidpointIntegrator repository get MonteCarloIntegrator repository get RandomGenerator repository get LinearFunction repository get NonlinearFunction repository get PiFunction create LinearFunction lin_func create NonlinearFunction nonlin_func create PiFunction pi_func create MonteCarloIntegrator mc_integrator create RandomGenerator rand create TauMeasurement tau connect mc_integrator RandomGeneratorPort rand RandomGeneratorPort connect mc_integrator FunctionPort nonlin_func FunctionPort connect mc_integrator MeasurementPort tau MeasurementPort create Driver driver connect driver IntegratorPort mc_integrator IntegratorPort go driver Go quit
Uintah Problem Solving Environment (U.Utah) • Enhanced SCIRun PSE • Pure dataflow component-based • Shared memory scalable multi-/mixed-mode parallelism • Interactive only interactive plus standalone • Design and implement Uintah component architecture • Application programmers provide • description of computation (tasks and variables) • code to perform task on single “patch” (sub-region of space) • Components for scheduling, partitioning, load balance, … • Follows Common Component Architecture (CCA) model • Design and implement Uintah Computational Framework (UCF) on top of the component architecture
Performance Analysis Objectives for Uintah • Micro tuning • Optimization of simulation code (task) kernels for maximum serial performance • Scalability tuning • Identification of parallel execution bottlenecks • overheads: scheduler, data warehouse, communication • load imbalance • Adjustment of task graph decomposition and scheduling • Performance tracking • Understand performance impacts of code modifications • Throughout course of software development • C-SAFE application and UCF software
Uintah Task Graph (Material Point Method) • Diagram of named tasks (ovals) and data (edges) • Imminent computation • Dataflow-constrained • MPM • Newtonian material point motion time step • Solid: values defined at material point (particle) • Dashed: values defined at vertex (grid) • Prime (’): values updated during time step
Task Execution in Uintah Parallel Scheduler • Profile methods and functions in scheduler and in MPI library Task execution time dominates (what task?) Task execution time distribution per process MPI communication overheads (where?) • Need to map performance data!
... Performance Data Mapping using TAU • Two level mappings: • Level 1: <task name, timer> • Level 2: <task name, patch, timer> • Embedded association vs External association Hash Table Data (object) Performance Data
Task Performance Mapping Instrumentation void MPIScheduler::execute(const ProcessorGroup * pc, DataWarehouseP & old_dw, DataWarehouseP & dw ) { ... TAU_MAPPING_CREATE( task->getName(), "[MPIScheduler::execute()]", (TauGroup_t)(void*)task->getName(), task->getName(), 0); ... TAU_MAPPING_OBJECT(tautimer) TAU_MAPPING_LINK(tautimer,(TauGroup_t)(void*)task->getName()); // EXTERNAL ASSOCIATION ... TAU_MAPPING_PROFILE_TIMER(doitprofiler, tautimer, 0) TAU_MAPPING_PROFILE_START(doitprofiler,0); task->doit(pc); TAU_MAPPING_PROFILE_STOP(0); ... }
Task Performance Mapping (Profile) Mapped task performance across processes Performance mapping for different tasks
Task Performance Mapping (Trace) Work packet computation events colored by task type Distinct phases of computation can be identifed based on task
Task Performance Mapping (Trace - Zoom) Startup communication imbalance
Task Performance Mapping (Trace - Parallelism) Communication / load imbalance
8 processes 32 processes 32 processes 32 processes 8 processes Comparing Uintah Traces for Scalability Analysis
Performance Steering Performance Monitoring Framework (K. Li) SCIRun Performance Visualizer Application || performance data streams TAU Performance System Performance Analyzer || performance data output Performance Data Integrator Performance Data Reader file system • sample sequencing • reader synchronization
2D Field Performance Visualization in SCIRun SCIRun program
3D Field Performance Visualization in SCIRun SCIRun program
Uintah Computational Framework (UCF) • Universityof Utah • UCF analysis • Scheduling • MPI library • components • 500 processes • Use for onlineand offlinevisualization • Incorporatesteering
Performance Tracking and Reporting • Integrated performance measurement allows performance analysis throughout development lifetime • Applied performance engineering in software design and development (software engineering) process • Create “performance portfolio” from regular performance experimentation (couple with software testing) • Use performance knowledge in making key software design decision, prior to major development stages • Use performance benchmarking and regression testing to identify irregularities • Support automatic reporting of “performance bugs” • Enable cross-platform (cross-generation) evaluation
XPARE - eXPeriment Alerting and REporting • Experiment launcher automates measurement / analysis • Configuration and compilation of performance tools • Instrumentation control for Uintah experiment type • Execution of multiple performance experiments • Performance data collection, analysis, and storage • Integrated in Uintah software testing harness • Reporting system conducts performance regression tests • Apply performance difference thresholds (alert ruleset) • Alerts users via email if thresholds have been exceeded • Web alerting setup and full performance data reporting • Historical performance data analysis
Mail server Web server XPARE System Architecture (A. Morris, Dav) Experiment Launch Performance Database Performance Reporter Alerting Setup Comparison Tool Regression Analyzer
Performanceanalysis programs Raw performance data Performance data description Performance analysis and query toolkit PerfDML translators ORDB PostgreSQL . . . PerfDB TAU Performance Database Framework (Li Li) • profile data only • XML representation • project / experiment / trial
TAU Status • Instrumentation supported: • Source, preprocessor, compiler, MPI, runtime, virtual machine • Languages supported: • C++, C, F90, Java, Python • HPF, ZPL, HPC++, pC++... • Packages supported: • PAPI [UTK], PCL [FZJ] (hardware performance counter access), • Opari, PDT [UO,LANL,FZJ], DyninstAPI [U.Maryland] (instrumentation), • EXPERT, EPILOG[FZJ],Vampir[Pallas], Paraver [CEPBA] (visualization) • Platforms supported: • IBM SP, SGI Origin, Sun, HP Superdome, HP/Compaq Tru64 ES, • Linux clusters (IA-32, IA-64, PowerPC, Alpha), Apple, Windows, • Hitachi SR8000, NEC SX, Cray T3E ... • Compilers suites supported: • GNU, Intel KAI (KCC, KAP/Pro), Intel, SGI, IBM, Compaq,HP, Fujitsu, Hitachi, Sun, Apple, Microsoft, NEC, Cray, PGI, Absoft, … • Thread libraries supported: • Pthreads, SGI sproc, OpenMP, Windows, Java, SMARTS
Work in Progress • Instrumentation of individual tasks • SCIRun based online performance data monitoring • Integration of XPARE with performance database framework • Support for complex SQL queries • Instrumentation of mixed mode (MPI+threads) Uintah executions • Instrumentation of Uintah CCA components using TAU CCA interface
Concluding Remarks • Modern scientific simulation environments involves a complex (scientific) software engineering process • Iterative, diverse expertise, multiple teams, concurrent • Complex parallel software and systems pose challenging performance analysis problems that require flexible and robust performance technology and methods • Cross-platform, cross-language, large-scale • Fully-integrated performance analysis system • Performance mapping • Need to support performance engineering methodology within scientific software design and development • Performance comparison and tracking