Download
1 / 18
180 likes | 289 Views
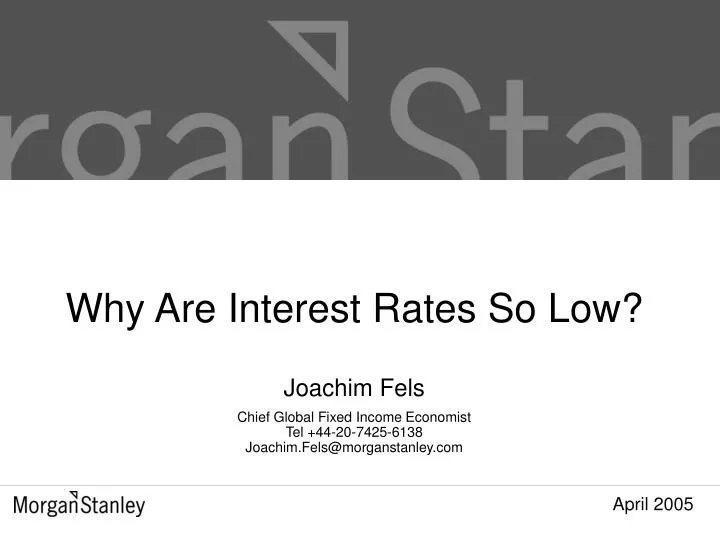
Why Are Interest Rates So Low?. Joachim Fels Chief Global Fixed Income Economist Tel +44-20-7425-6138 Joachim.Fels@morganstanley.com. April 2005. A 300-Year View: Nominal Interest Rates Are Not Exceptionally Low. UK Nominal Long-Term Interest Rate (2.5% Consol).

E N D
Why Are Interest Rates So Low? Joachim Fels Chief Global Fixed Income EconomistTel +44-20-7425-6138Joachim.Fels@morganstanley.com April 2005
A 300-Year View:Nominal Interest Rates Are Not Exceptionally Low UK Nominal Long-Term Interest Rate (2.5% Consol) Sources: Datastream, Global Financial Data, DMO, D.Miles, M. Baker, V. Pillonca, Where Should Long-Term Interest Rates Be Today? A 300 Year View, Morgan Stanley, 9 March 2005
A 300-Year View:But Real Interest Rates Are Very Low UK Real Long-Term Interest Rate Sources: Datastream, Global Financial Data, DMO, D.Miles, M. Baker, V. Pillonca, Where Should Long-Term Interest Rates Be Today? A 300 Year View, Morgan Stanley, 9 March 2005
Real Yields on US and French Inflation-Proof Bonds * This is not a continuous series; it links together bonds to approximate a 10-year series. Discontinuities are marked.Source: Bloomberg, French Treasury, Morgan Stanley Research
Greenspan’s Conundrum Long-Term Yields Fell During 2004 Despite Fed Tightening… …Resulting in a Flattening of the US Yield Curve Source: Datastream, Morgan Stanley Research
Five Implausible Explanation for Low Yields • Growth pessimism has depressed real yields But: why then are equities up and risk spreads low? • Deflation fears have depressed nominal yieldsBut: survey- and market-based inflation expectations have risen • Lower risk premium due to higher central bank credibility But: whence a sudden surge in credibility? • Rising risk aversionBut:risky assets have even outperformed bonds until March • Asia central banks’ appetite for TreasuriesBut: Euro bonds have rallied even more
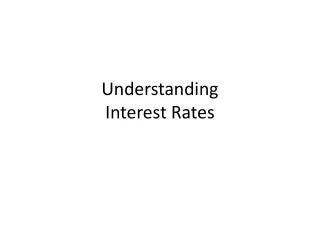
300 250 200 150 100 50 0 90 91 92 93 94 95 96 97 98 99 00 01 02 03 04 05 Japan Europe U.S. Global Credit Spreads: Tight, Tighter, the Tightest bp Source: Morgan Stanley Research, MSCI, Yield Book Note: Chart shows premium for owning BBBs over AAs.
However, Risk Spreads Have Widened Recently US and European Credit Spreads on the Rise As Are Emerging Market Spreads Source: Datastream, Morgan Stanley Research
US Inflation Expectations on the Rise Breakeven Inflation Rates: US versus Euro Area • The correlation between US and euro area inflation expectations appears to have broken down recently • Markets are pricing in higer inflation in the US, lower in the euro area • Good reasons for further divergence: EUR/USD strength & productivity growth convergence • More European bond outperformance ahead Source: Bloomberg, Morgan Stanley Research
The Real Culprit: Excess Liquidity … Indicators of Global Excess Liquidity • Record-low interest rates have pumped up money supply and credit • The outstanding stock money and credit relative to nominal GDP is at a record high • ECB to take over from Fed as marginal provider of excess liquidity • Excess liquidity is pushing up the prices of real and financial assets • This raises the two-way risk to future inflation – inflation or deflation could result Source: IMF, OECD, Morgan Stanley Research
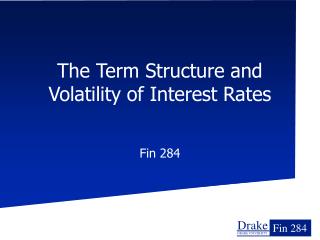
6 6 %YoY 5 5 4 4 Euroland 3 3 2 2 1 1 0 0 -1 -1 -2 -2 US -3 -3 1990 1992 1994 1996 1998 2000 2002 2004 Reflecting Ueber-Expansionary Monetary Policies The Big Monetary Easing: Real Short Rates in Negative Territory • Recession, post-bubble woes and deflation fears led the big central banks to open the floodgates • The consequences of negative real interest rates … • … excess liquidity, over-investment, asset bubbles … • … and a sharp cyclical rebound fuelling an endogenous oil price shock Source: Datastream, Morgan Stanley Research
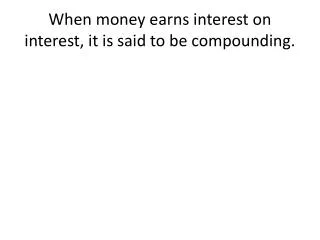
31% % Deviation from predicted prices, RHS 1600 40 1500 Actual 1400 30 26% 1300 1200 20 1100 Fitted 1000 10 900 800 0 700 600 -10 500 400 -20 300 200 100 -30 1978 1980 1982 1984 1986 1988 1990 1992 1994 1996 1998 2000 2002 2004 How Much of a Housing Bubble in Spain? Spanish House Prices: Actual, Predicted and Gap • Valuation model linking long-run trend in house prices to household disposable income and the equity market return • As in UK, interest rates help explain short-run dynamics, but not long-run trend of house prices • As in UK, model suggests Spanish house prices some 30% above fair value • High vulnerability when ECB raises rates and/or economy falters Source: Bank of Spain, Morgan Stanley Research
Five Scary Parallels with the 1970s • Oil shock:the price of oil quintupled from 1971-74 and from 1999-2004 • Competitive shock:new competitors in world markets cause dislocation. Now: China & India, then: Japan and Korea • Productivity slowdown:just as the 1960s productivity boom gave way to the 1970s slowdown, we are now at the tail-end of the recent productivity boom • Expansionary monetary policy:as in the 1970s, central banks appear to be willing to accommodate negative supply shocks • Fiscal slippage:rising budget deficits reflecting economic weakness and (in the US) the financing of an expensive war (then Vietnam, now Iraq)
US Productivity Growth: The Best is Behind Us US Productivity Growth Moves in Long Cycles • We are likely at the tail-end of the IT-enabled productivity acceleration that started in the mid-1990s • The easy productivity gains have been made, especially in the US, and productivity growth should normalise in the coming years • If the Fed overestimates trend growth, as it did in the 1970s, its policy will be inflationary Source: Bureau of Labor Statistics, Morgan Stanley Research
The Case for Higher Global Inflation • Central banks want it as a safety margin against deflation • Indebted consumers, companies and governments want it to alleviate the real burden of debt • Structurally high demand for oil and other raw materials provides cost push • Expansionary monetary and fiscal policies provide demand pull • The productivity boom in the US is behind us
Towards Higher Fiscal Deficits • The Euro’s fiscal framework is in shambles The new Stability and Growth Pact lacks teeth. The political sanction mechanism for fiscal sinners has been virtually abolished. • Markets don’t sanction fiscal profligacy either Yield spreads between government bonds in the euro area are extremely tight • Why markets are unable and unwilling to impose discipline (1) Most countries are fiscal sinners now; (2) excess liquidity compresses yield spreads; (3) markets believe the non-bailout clause in the Maastricht treaty is not credible; (4) the ECB treats all governments as equal at its refi operations • Without sanctions, look for higher deficits Political tensions between member states will rise and more pressure on the ECB to engineer higher inflation will result. The worst case scenario is EMU break-up