Download
1 / 22
220 likes | 383 Views
1. One-Way Analysis of Variance. Comparing means of more than 2 independent samples. Why not multiple t-tests?. 1. # comparisons = k(k-1)/2, where k is the # of groups. In other words, when there are many more than 2 groups, the number of comparisons is large

E N D
1 One-Way Analysis of Variance Comparing means of more than 2 independent samples
Why not multiple t-tests? 1 • # comparisons = k(k-1)/2, where k is the # of groups. In other words, when there are many more than 2 groups, the number of comparisons is large • In each separate comparison, you only use information within that pair – but information within other pairs may increase power • If you do multiple tests, you have multiple answers, not just one • With many tests, type 1 error rates increase radically 2 3 4 4
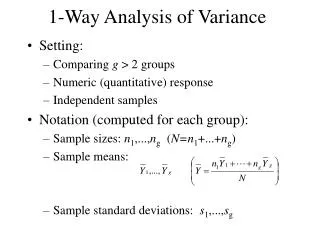
ANalysis Of VAriance • 1-way ANOVA • Grouping variable = factor = independent variable • The variable will consist of a number of levels • If 1-way ANOVA is being used, the number will be >2. • E.G. What type of program has the greatest impact on aggression? • Violent movies, soap operas, or “infomercials”? • Type of program is the independent variable or factor, while soap operas is one level of the factor, & aggression is the dependent variable 1 2 3
1-way ANOVA: Hypotheses • Null: • Alternative (experimental): • Note: no directional hypothesis; Null may be false in many different ways 1 2 3
1-way ANOVA: Logic • Change in test statistic • Recall with t-tests, test statistic is • But with ANOVA, test statistic is 1 2
1-way ANOVA: Logic • Return to our example… 1 2 4 3
1-way ANOVA: Logic • Variance between sampling means • Known as “between group variance” • Think of what could cause these means to differ (vary) from each other • Treatment effect: differences due to the different ways the groups were treated (systematic variation) • Chance: Individual differences, experimental error (unsystematic, unexplained variation) 1 2
1-way ANOVA: Logic • Variance expected by chance (error) • Known as “within group variance” • Think of what could cause the scores within the groups to differ from each other • Chance: Individual differences, experimental error (unsystematic, unexplained variation) 1
1-way ANOVA: Logic • Partitioning the variance = 1 Total variance • Between group variance: • Treatment • Chance • Within group variance • Chance + 3 2
1-way ANOVA: Logic • The test statistic for the 1-way ANOVA • The F-ratio • If null is true • If null is false 1 2 3
1-way ANOVA: Logic • More on the F-statistic • F is a statistic that represents ratio of two variance estimates • Denominator of F is called “error term” • When no treatment effect, F 1 • If treatment effect, observed F will be > 1 • How large does F have to be to conclude there is a treatment effect (to reject H0)? • Compare observed F to critical values based on sampling distribution of F • A family of distributions, each with a pair of degrees of freedom 1
The F-distribution • As with t-distribution, a family of curves • Shape of distribution changes with df • If null is true, F≈1 • “p” largest at 1 • “p” tapers as F > 1 • F-values always positive (variance can’t be negative) Probability Region of rejection 0 1 2 3 4 5 6 7 8 F values F.05 = 5.14 1 2
Hypothesis Testing with ANOVA • Research question • Does the type of programming affect levels of aggression? • Statistical hypotheses • H0: 1 = 2 = ... = k • H1: At least 2 means are significantly different • Decision rule (critical value) • Compute observed F-ratio from data • Make decision to reject or fail to reject H0 • If H0 rejected, conduct multiple comparisons as needed 1
Computing ANOVA • For those interested (?!) we’ll cover the steps and do an example (not necessary if you understand the concept…but it may help) • If you’re really confident, skip to slide 21 • Steps to completion • Compute SS (sums of squares) • Compute df • Compute MS (mean squares) • Compute F 1 2 3
Computing ANOVA • Vocabulary/Symbols: • k = Number of groups • nj = Sample size of the jth group (n1, n2,…nj,…nk) • N = Total sample size • = Mean of the jth group • = Grand (overall) mean • SS (Sum of squares) = Sum of squared deviations around a mean 1
Computing ANOVA • Step 1: Compute Sums of Squares (SS) • Need total, group, and error sums of squares • These are combined with appropriate df to give variance calculations, & then generate F-ratio 1 2
Computing ANOVA • Step 1: Compute Sums of Squares (SS) • Total sum of squares (looks a little daunting, but it’s really not) 2 4 3 1 2. The second part of the formula is the one we’ll use in the calculations, as it’s easier to work with. The first one is easier to conceptualize. 1. This is just the sum of the squared deviations of each observation from the overall mean
Computing ANOVA • Step 1: Compute Sums of Squares (SS) • Group sum of squares 1 1. This is the sum of the squared deviations of each group mean from the overall mean (multiplied by each sample’s size)
Computing ANOVA • Step 1: Compute Sums of Squares (SS) • Error sum of squares • Total variance is composed of SSgroup & SSerror • SStotal = SSgroup + SSerror • Rearrange this formula to get: • SSerror= SStotal – SSgroup 1 2 • 1. To calculate, take the sum of squares of each observation within a group from its group mean, for all groups 3
Computing ANOVA • Step 2: Compute degrees of freedom • (Used to adjust SS to variance estimates) • df group: • df total: • df error (or “what’s left over”): 1 2 3
Computing ANOVA • Step 3: Compute Mean Squares (MS) & F-ratio • Mean Square = variance 1 2 3
Computing ANOVA • The ANOVA summary table (may help you understand where it comes from in SPSS) • all the processes are alluded to above 1