Download
1 / 30
340 likes | 542 Views
Human Life Tables and Survivorship Curves. PURPOSE:. Test hypotheses about human survivorship using: Life tables life expectancy Survivorship curves. H 1 Females have a greater life expectancy than males because of risky male behaviors and the toxic effects of testosterone.

E N D
PURPOSE: Test hypotheses about human survivorship using: Life tables life expectancy Survivorship curves
H1 Females have a greater life expectancy than males because of risky male behaviors and the toxic effects of testosterone. • prediction: the survivorship curve and the calculated life expectancy for females is higher than that for males. • H2 Females are more likely to die during the reproductive years because of the risks associated with pregnancy. • prediction: the calculated life expectancy for males during the reproductive years is higher than that for females and the dx value is greater for females during the reproductive years. Hypotheses aboutMales and Females
H3 Human life expectancy has increased with time due to advances in medicine, nutrition, and sanitation. • prediction: survivorship curves and calculated life expectancies are higher for newer graveyards. Hypotheses aboutPublic Health BRB R.I.P.
What are life tables? • A life table contains age-specific survival and mortality rates in a population. It also contains fecundity and age distribution information. • Life tables come in 2 varieties: • Cohort life table: Follows a group of individuals born at the same time. • Static life table: Constructed by recording the age at death of a large number of individuals. This is what we’ll be making.
Life Tables X = a reference number we assigned to refer to the different classes
Life Tables X = a reference number we assigned to refer to the different classes
Life Tables X = a reference number we assigned to refer to the different classes
Life Tables dx= the number of individuals that die in the x age class.
Life Tables nx= total number of individuals surviving to the x age class. nx0 (the first nx ) is always the sum of dx
Life Tables nx= total number of individuals surviving to the x age class. nx = nx-1- dx-1
Life Tables nx= total number of individuals surviving to the x age class. nx = nx-1- dx-1
Life Tables nx= total number of individuals surviving to the x age class. nx = nx-1- dx-1
Life Tables (lx) Survivorship: Portion of population that survived to the x age class
Life Tables (lx) Survivorship: Portion of population that survived to the x age class
Life Tables (lx) Survivorship: Portion of population that survived to the x age class
Life Tables ax = Given you reach the x age class, what is the probability you live to the NEXTage class.
Life Tables ax = Given you reach the x age class, what is the probability you live to the NEXTage class.
Life Tables qx = Given you reach the x age class, what is the probability you do NOT live to the NEXTage class.
Life Tables qx = Given you reach the x age class, what is the probability you do NOT live to the NEXTage class.
Life Tables qx = Given you reach the x age class, what is the probability you do NOT live to the NEXTage class.
Life Tables ax + qx = 1
Life Tables ax + qx = 1 Make three: Males, Females, and Totals for your group’s data
How can we test whether health issues influence survivorship, or if there is a difference between males and females? Life Expectancy The amount of time one is expected to live once age class x is reached or during a specified period of time.
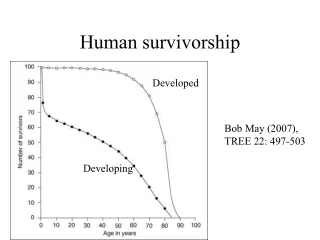
Make 2: your data (Male vs. Female) • previous data (Old vs. New) Survivorship curves: BRB R.I.P.
Graph dx for males vs. females and old vs. new. What does this tell us?
Male vs. female Male vs. female childbearing Binomial tests
A lot of data… To leave today you need 1) Three life tables (male, female, all) using lab section’s data 2) Eight life expectancies 3) Survivorship curve (M and F) (lab section data) 4) Survivorship curve (Old and New) (Previous Data) 5) dx graphs 6) Binomial tests: male vs. female and male vs. female childbearing (all five lab sections)