Download
1 / 9
100 likes | 220 Views
Learn to recognize and plot quadratic graphs in various scenarios such as ballistics and projectile motion. Discover how to determine maximum height and distance reached by objects, optimize range based on initial speed, and sketch parabolic paths efficiently.

E N D
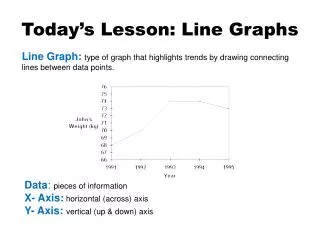
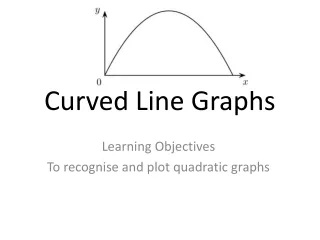
Curved Line Graphs Learning Objectives To recognise and plot quadratic graphs
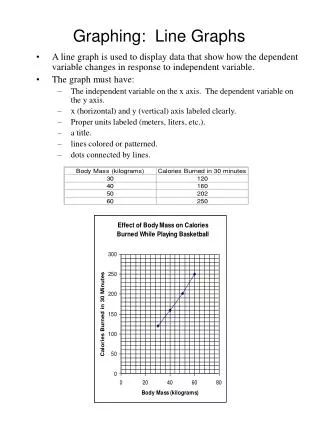
Ballistics • When an object is thrown into the air, its distance above the ground is given by this equation: y = -5x2 + ux (y is the distance, x is the time, u is the speed) Plot the graph of a bullet shot at 200m/s: y = -5x2 + 200x What is the maximum height reached? How far above the ground is the bullet after 10s?
Maximising Range Initial Speed at 45° to the horizontal Parabolic path
How to sketch a quadratic Eg. y = x2 + 3x + 2 • Find the point where it crosses the y-axis (ie where x = 0) • Find the point(s) – if any – where it crosses the x-axis (ie where y = 0) • Find the maximum or minimum point (if positive x2 min, if negative, max) Substitute x = 0 into equation y = x2 + 3x + 2 y = (0)2 + 3(0) + 2 = 2 2 (x + 1)(x + 2) = 0 x = -1, x = -2 -2 -1 Factorise, complete the square or use the formula (-1.5,-0.25) y = (x + 1.5)2 – 2.25 + 2 y = (x + 1.5)2 – 0.25 Min: y = -0.25 at x = -1.5 Complete the square
Sketch the following graphs. Remember to give co-ordinates of any points where the graph crosses the axes and any minimum or maximum points.