Download
1 / 39
390 likes | 931 Views
Geog 090 – Quantitative Methods in Geography. Geography is a diverse discipline, that seeks to understand our world in terms of space and place Geographers use quantitative approaches to describe, understand, and assess geographic phenomena

E N D
Geog 090 – Quantitative Methods in Geography • Geography is a diverse discipline, that seeks to understand our world in terms of space and place • Geographers use quantitative approaches to describe, understand, and assess geographic phenomena • This course will provide you with an introduction to quantitative approaches in geography
Geog 090 – Quantitative Methods in Geography • Quantitative methods refers primarily, but not exclusively, to statistics • Descriptive and inferential (univariate and multi-variate to a lesser extent) statistical methods, BUT • Background and theory that you need to make use of statistics properly in the context of geography
Goals • The goals of this course are: • To help students understand the purpose, meaning, and use of statistics in geographic research. • To introduce basic statistical methods used by geographers in research. • To learn how to use computer spreadsheets to simplify geographic problem solving. • To learn how to apply statistical techniques to real geographical problems.
Required Textbook • Statistical Methods for Geography by Peter Rogerson • Available at Student Stores • This text is very readable and rather concise (unlike many stats texts that are rather verbose)
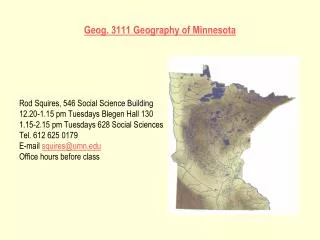
Lectures - Where, When, and Who • Website: • http://www.unc.edu/courses/2006spring/geog/090/001/www
Grading Policy • Assignments: 30% (6 * 50 points) • Exam I: 20% (200 points) (Feb 21, 2006) • Exam II: 20% (200 points) (Mar 30, 2006) • Final Exam: 30% (300 points) (May 02, 2006) Note: Any student failing to take an exam will score zero for that test unless a legitimate, documented reason is presented.
Chapel Hill, NC (January 08, 2006) Source: http://www.wunderground.com/
Descriptive Statistics • Measures of central tendency • Measures of the location of the middle or the center of a distribution • Mean, median, mode • Measures of dispersion • Describe how the observations are distributed • Variance, standard deviation, range, etc
Chapel Hill, NC (January 08, 2006) Source: http://www.wunderground.com/
Geographic Data & Problems: Scale • Vector data • Point • Line • Area • Scale (e.g., 1:24, 000) • Raster data • Gridded data • Spatial resolution (e.g., 30m)
GTOPO30 is a Global Digital Elevation Model (DEM) (GTOPO30, 1km) Source: http://edc.usgs.gov/products/elevation/gtopo30/gtopo30.html
Source: Bateson, Asner, & Wessman 2000, IEEE, 38, p1083-1094
Sources of Outliers: • Data errors – First check for data recording or entry errors. • Rare event – Extreme observations that for some legitimate reason do not fit within the typical range of other data values. • a 80 degree day in January in Chapel Hill, NC • a 500 point rise/drop in a stock market index
The most common probability distribution is the normal distribution The normal distribution is a continuous distribution that is symmetric and bell-shaped The Normal Distribution Source: http://mathworld.wolfram.com/NormalDistribution.html
99.7% 95% 68% Normal Distributions f(x) -3σ -2σ -1σμ+1σ+2σ +3σ
Hypothesis Testing • An important component of scientific method is the testing of hypotheses either through experiments or predictive forms of analysis • A hypothesis can be defined as a tentative assumption that is made for the purpose of empirical scientific testing • A hypothesis becomes a theory of science when repeated testing produces the same conclusion.
Hypothesis Testing • ExampleI– Urban Heat Island Effect • Does this effect exist? • Is there a significant difference in temperature between urban and adjacent areas? • Is there a significant difference in precipitation between urban and adjacent areas?
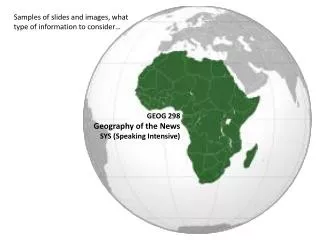
Hypothesis Testing • ExampleII– Crimes Rates Source: http://www.ggy.uga.edu/courses/geog4300/
Analysis of Variance (ANOVA) • Hypothesis testing allows us to compare two samples in terms of some descriptive measure of those samples • In some instances, we wish to compare more than two samples, in order to see if there are significant differences between them: Suppose we have soil moisture samples from 4 or 5 different catchments on the same day, and we want to determine whether or not any of them are significantly wetter or more drier than the others
Briggs & Knapps, 1995, American Journal of Botany, 82, 1024-1030 NPP = GPP - Rp
Alward et al., 1999, Science, 283, p229-231 “Increased spring Tmin was correlated with decreased NPP by the dominant C4 grass and with increased abundance and productivity by exotic and native C3 forbs.”
Northern high latitudes (40°N-70°N) Northern middle latitudes (23.5°N-40°N)
Source: http://ohioline.osu.edu/for-fact/0035.html Source: Peper et al.: Predicting Diameter, Height, Crown Width, and Leaf Area
Crown Size a: Max crown width b a b: Min crown width Mean Crown Width (MCW) Aboveground biomass of each tree (tons) Pacific Northwest (PNW) Forest Inventory Analysis (FIA) database (PNW-FIA database)
Annual Precipitation of Two Weather Stations in Raleigh, NC A: 1950-2004; B: 1931-2004
Relationship in annual precipitation between A and B (1950 – 2004) (R2 = 0.82)