Download
1 / 25
250 likes | 348 Views
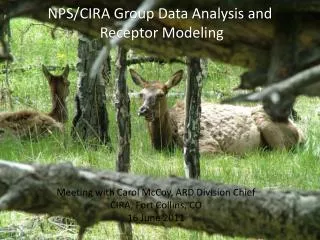
Chemical transport modeling in support of NPS-CIRA activities. Mike Barna 1 Marco Rodriguez 2 Kristi Gebhart 1 Bret Schichtel 1 Bill Malm 1 Jenny Hand 2 1 ARD-NPS, Fort Collins, CO 2 CIRA, Fort Collins, CO June 16, 2011. National Park Service U.S. Department of the Interior.

E N D
Chemical transport modeling in support of NPS-CIRA activities Mike Barna1 Marco Rodriguez2 Kristi Gebhart1 Bret Schichtel1 Bill Malm1 Jenny Hand2 1 ARD-NPS, Fort Collins, CO 2 CIRA, Fort Collins, CO June 16, 2011 National Park Service U.S. Department of the Interior Cooperative Institute for Research in the Atmosphere
Air quality models, generally speaking • Air quality models are ‘transfer functions’ that convert emissions to impacts (concentration & deposition) at downwind receptors • They are useful for… • Filling in gaps of unmonitored species • Developing source apportionments • Evaluating ‘what if’ scenarios • A component in a weight-of-evidence evaluation • Want to employ current ‘state-of-the-science’ models in our work
Models used for regulatory work one atmosphere models near-field models puff models e.g., AERMOD What are the peak exposure levels very near a source? e.g., Calpuff What are the impacts from this powerplant plume? e.g., CAMx What is the chemical state of the atmosphere, and which sources influenced it? complexity
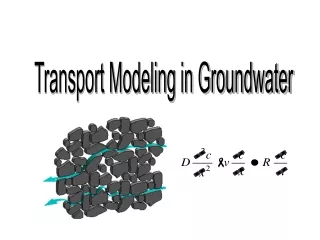
How CAMx works • CAMx treats the atmosphere as a big box (the ‘model domain’) which is then chopped-up into a bunch of little boxes. • In each little box, the chemical evolution over time is evaluated, and once per hour the concentration and deposition of species is reported.
Things that CAMx can do (or try to do) easier • Sulfate • Ozone • Oxidized nitrogen • Reduced nitrogen • Organics • Deposition • Wind blown dust • Toxics/mercury harder
Current modeling efforts • Simulating oxidized and reduced nitrogen impacts at Rocky Mountain NP (RoMANS2) • Examining the ‘carrying capacity’ of western US airsheds in terms of nitrogen deposition and ozone • Air quality impacts from oil and gas development • Fire impacts on regional ozone (DEASCO3)
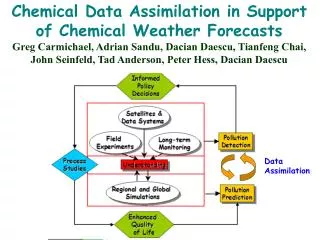
Need a large-scale perspective • Pollutants and precursors can travel 100’s – 1000’s kms before reaching a receptor • Lots of things can happen en route: • Chemical transformation • Deposition (Tong & Mauzerall, 2008)
The NPS – CIRA modelers • Kristi Gebhart (NPS), Marco Rodriguez (CIRA), Mike Barna (NPS) • Modeling hardware: • 30 Xeon cores • 60 GB memory • 50 TB storage
Two examples of current modeling • Nitrogen deposition • Ozone
Where does the nitrogen go? • NH3: rapid deposition, NH3 NH4+, no gas-phase oxidation • NOx: complicated photochemistry, HNO3 NO3-, some species rapidly deposit (HNO3, NO.) NH3 NOx
Simulated nitrogen CASTNet species: example ‘missing N’ species:
RoMANSCAMx results, April 2006 Beaver Meadows (RMNP) Grant, Nebraska NH4+ NO3 SO4= NH3 HNO3 SO2
Example CAMxapportionment (w/PSAT) spring: summer:
CAMx tracer runs • Another apportionment tool is to treat emissions as conserved tracers, and then apply statistical models to indicate largest contributors
Western ozone trends (Jaffe & Ray, 2007)
Observed peak 8hr ozone (2004 – 2006) (WRAP, 2010)
Should we focus on VOCs or NOx? HCHO and NO2 can be detected from the OMI satellite, and provide ‘indicator species’ to help assess whether a region is VOC or NOx limited. HCHO/NO2 > 1 Suggests NOx limited (Duncan et al., 2010) HCHO NO2 HCHO/NO2
Summary • Established modeling group working on issues important to NPS, including nitrogen deposition and ozone • It’s notable that several of our projects are linked to nitrogen emissions • Future projects: • Climate change influence on regional air quality • Fire impacts