Download
1 / 26
290 likes | 1.52k Views
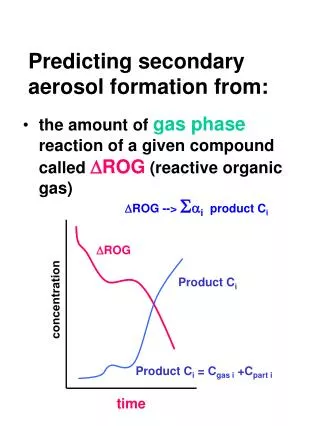
CMAQ Parameterizations of Cloud-Produced Secondary Organic Aerosol Ann Marie Carlton International Aerosol Modeling Algorithms Conference University of California, Davis December 6, 2007 SOA Formation Through Cloud Processing In-cloud chemistry Cloud evaporation SOA

E N D
CMAQ Parameterizations of Cloud-Produced Secondary Organic Aerosol Ann Marie Carlton International Aerosol Modeling Algorithms Conference University of California, Davis December 6, 2007
SOA Formation Through Cloud Processing In-cloud chemistry Cloud evaporation SOA Reactive organic emissions • Gas phase organic emissions are oxidized (e.g., in the interstitial spaces of clouds) forming water-soluble organic gases. • Water-soluble gases partition into cloud droplets where they oxidize further, forming low volatility products. • These products remain in the particle phase upon cloud evaporation, contributing secondary organic aerosol (SOA).
Objective • Include “cloud processing” SOA pathway in 3-dimensional regional scale air quality simulations using CMAQ • Clouds provide a means of transporting constituents from the boundary layer to the free troposphere • More than 90% of cloud droplets evaporate Motivation • CMAQ (and other models) under predict OC, in particular during the summer • The underprediction is greatest for aloft layers Hypothesis • In-cloud chemistry explains, in part, the uderprediction aloft Plausibility
GEOS-Chem OC Predictions Heald et al., GRL (2005)
Aug. 14, 2004 - clouds Aug. 11 – NYC plume CMAQ & ICARTT OC comparisons Aug. 3 – new england CMAQ OC prediction Aug. 15 transit to FL via Atlanta Aug. 6 Ohio Valley power plants ICARTT WSOC meas. v4.6 SAPRC, AE4, 12km, eastern U.S.
Transition from laboratory to regional scale modeling • Sophisticated chemical mechanism not suitable for current CMAQ aqueous chemistry module (aqchem) • forward Euler solver for oxidation and bisection method for pH (note linear convergence for bisection method)
Molar conc. = initial amt. – amt. deposited (mol L-1) bisection for pH, initial guesses between 0.01 – 10 liquid conc. (mol L-1) SO4, HSO4, SO3, HSO3, CO3, HCO3, OH, NH4, HCO2, NO3, Cl Start iteration and bisection (3000 iterations) Calc. final gas phase partial pressure of SO2, NH3, HNO3, HCOOH, CO2 liquid conc. (mol L-1) SO4, HSO4, SO3, HSO3, CO3, HCO3, OH, NH4, HCO2, NO3, Cl Check for convergence Check for convergence Compute ionic strength and activity coefficient (Davies Eqn.) Calculate liquid concentrations and final gas phase concs. of oxdidants Cal. Min time step – check for large time step Kinetic calcs SIV oxidized < 0.05 of SIV oxidized since time 0, double DT Don’t let DT > TAUCLD 1000 max. iterations Compute wet depositions and phase concentrations for each species TIME = TAUCLD (OR 1000 iterations) CMAQ Aqueous Chemistry Map(aqchem.F)
Enhance Representation of Aqueous Chemistry in CMAQ • Improve partitioning parameterization • Develop Rosenbrock Solver • Comparison with box model for chemical mechanism (Barth et al., 2003) using a Gear solver • Develop generalized solver for a mechanism that represents the same aqueous chemistry currently in CMAQ for benchmarking • Extend to include advanced organic chemistry • Laboratory based • Sensitive reactions determined in parcel model (Ervens et al. 2007)
Gas-to-drop partitioning Enhancing CMAQ Aqueous Chemistry Current CMAQ parameterization volatilization sink reactions aqueous production accommodation interfacial processes by Schwartz (1986)
Partitioning: Reaction Types kd • Acid/Base Equilibrium: [HA] [H+] + [A-] ka • Oxidation:
Rosenbrock Method Where J is the Jacobian
ROS3 GEAR Comparison with Gear Solver in Box Model Test Acknowledge: Gerry Gipson
Complex and Explicit Chemistry Balanced with CMAQ Implementation • Yield-based parameterization (similar to how ‘traditional’ SOA modeling began) • Calculated maximum yield for oxalic acid from lab data (0.02) • Assumed same yield for higher MW species • Assumed same yields for MGLY as for GLY • Altieri et al., (2007) • OM:OC for cloud produced aerosol ~2 • MW for cloud produced aerosol ~177 g mol-1
2 chemical “reactions” added to aqchem Parameterization is based on laboratory experiments GLY and MGLY react with OH to make non-reactive species “AORGCJ” Reacting species (GLY, MGLY, OH) decrease C...CALCULATE IN-CLOUD SOA PRODUCTION C...Calculate GLY oxidation due to OH DGLYDT = -1.0 * (RGLY3 ) * GLYL * OHL C...Calculate MGLY oxidation due to OH DMGLYDT = -1.0 * (RMGLY3) * MGLYL * OHL C…Calculate AORGC Production DORGC = DORGC - ( ( 0.04 * DGLYDT * DTW( 0 ) ) & + ( 0.04 * DMGLYDT * DTW( 0 ) ) ) In-cloud SOA production added to CMAQ
CMAQ Model Testing • 12km simulation for August 2004 • CMAQ V4.6, SAPRC, AE4 • 12km simulations, 14 vertical layers up to 100mb • Meterology • MM5 v3.6.3, with data nudging • Pleim-Xu land surface scheme, Reisner 2 microphysics, Kain-Fritsch cumulus parameterization, RRTM radiation parameterization • Emissions • 2001 inventory updated: point source emissions from base inventory by observed CEM data and Mobile 6 emission model • Biogenic emissions estimated using BEIS 3.13
urban plume o– OC prediction including SOAcld o – OC prediction without SOAcld -o- WSOC measurements Solid line is aircraft altitude; secondary y-axis Where CMAQ did not predict a cloud encountered by the NOAA-P3: predicted OC did not differ between simulations and both predictions for this time period were biased low. Concentration (mgC/m3) Altitude (m) Time (UTC) August 14, 2004 ICARTT Cloud Experiment
Aug. 14 cloud experimentVertical Profile Vertical profile: comparison of CMAQ-predicted OC and PILS WSOC measurements ICARTT PILS WSOC meas. Base CMAQ CMAQ w/ AORGC
Aug. 14 cloud experiment r2=0.74 x = CMAQ with cloud-produced SOA, o = base CMAQ OC prediction
Layer 6 (cloud base height) Fraction of Total SOA that is Cloud–Produced Heald et al., (2006) – variability in OC measurements not predicted well
Monthly averages for all sites in the model domain - August 2004 Comparison with ground-based OC measurements Total Carbon (OC + EC) Comparison IMPROVE STN
Findings and Implications • We expect SOA to form in aerosol water and cloud droplets • We expect this pathway to contribute SOA regionally and globally • SOA aloft has implications for long range transport and climate • Model performance enhanced for OC prediction when SOA cloud processing pathway is included – particularly aloft • Long range pollution transport • Global climate
Future Directions • Include Ervens et al. (2007) yield parameterization • Test this process for different seasons and locations • Full U.S., also in winter • Incorporate more explicit chemistry into CMAQ with a Rosenbrock solver • Find balance between more explicit chemistry and computational efficiency • Compare with other data sets • TexAQS; Speciated rain or cloud data; deposition measurements
Acknowledgements • Gerald Gipson, Shawn Roselle, Rohit Mathur • Charles Chang • Barbara Ervens, Katye Altieri, Barbara Turpin, Sybil Sietzinger • Rodney Weber
Disclaimer The research presented here was performed under the Memorandum of Understanding between the U.S. Environmental Protection Agency (EPA) and the U.S. Department of Commerce’s National Oceanic and Atmospheric Administration (NOAA) and under agreement number DW13921548. This work constitutes a contribution to the NOAA Air Quality Program, it does not necessarily reflect the views or policies of NOAA or EPA.