Download
1 / 17
170 likes | 279 Views
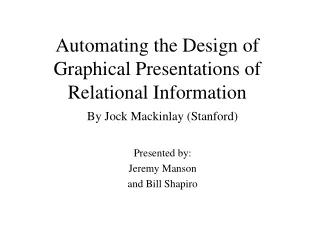
Art and Science of Graphical Presentations. Statistics for Management and Economics Chapter 3. Objectives. “Graphical Excellence” “Graphical Deception” Presenting Statistics: Written Reports and Oral Presentations. I love this one….

E N D
Art and Science of Graphical Presentations Statistics for Management and Economics Chapter 3
Objectives • “Graphical Excellence” • “Graphical Deception” • Presenting Statistics: Written Reports and Oral Presentations
I have a great subject [statistics] to write upon, but feel keenly my literary incapacity to make it easily intelligible without sacrificing accuracy and thoroughness. -Sir Francis Galton
“Graphical Excellence” 1) Large data sets are presented concisely and coherently. Source: www.nsf.gov. National Science Foundation, Division of Science Resources Statistics Information Cards: Science and Engineering Indicators 2004 NSB 04-01B (Arlington, VA).
“Graphical Excellence” 2) The message being presented by the chart is clear. Source: National Training Center’s pyramid graph of Average Learning Retention Rates
“Graphical Excellence” 3) The comparison of two or more variables is aided.
“Graphical Excellence” 4) The substance of the data, not the form of the graph is prominent.
“Graphical Excellence” 5) There is no distortion of the data and findings. Source: Norton. How to Lie with Statistics. Darrell Huff, 1954
“Graphical Deception” Graphical techniques create a visual impression, which is easy to distort, therefore… It is VERY important be able to critically evaluate graphically presented information. • Be wary of graphs without a scale on one axis. • Understand the information being presented: absolute values? relative values (e.g. percentages, deltas)? • Are the horizontal or vertical axes distorted in any way?
Written Reports and Oral Presentations • Know Your Audience • A report will be more “wordy” and less pictorial than an oral presentation • In an oral presentation, you are usually looking to get your point across in a brief amount of time • Know Your Audience