Download
1 / 26
260 likes | 467 Views
Queuing. CEE 320 Anne Goodchild. Example 2. You are now in line to get into the Arena. There are 3 operating turnstiles with one ticket-taker each. On average it takes 3 seconds for a ticket-taker to process your ticket and allow entry. The average arrival rate is 40 persons/minute.

E N D
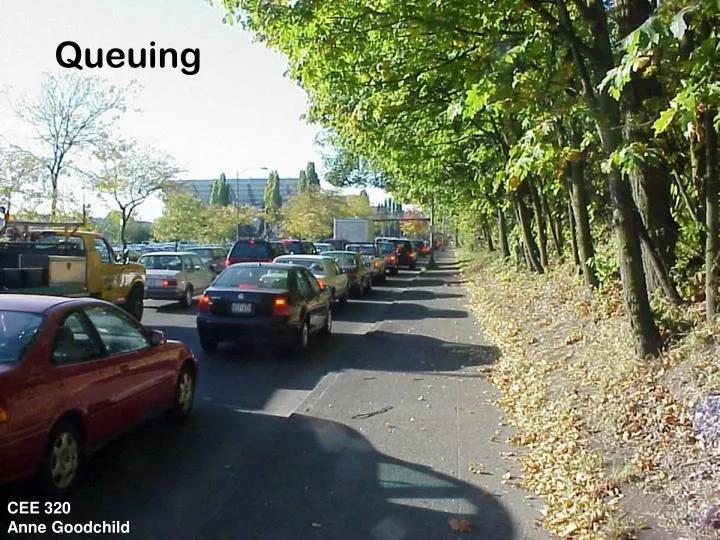
Queuing CEE 320Anne Goodchild
Example 2 You are now in line to get into the Arena. There are 3 operating turnstiles with one ticket-taker each. On average it takes 3 seconds for a ticket-taker to process your ticket and allow entry. The average arrival rate is 40 persons/minute. Find the average length of queue, average waiting time in queue assuming M/M/N queuing.
Example 2 • N = 3 • Departure rate: μ = 3 seconds/person or 20 persons/minute • Arrival rate: λ = 40 persons/minute • ρ = 40/20 = 2.0 • ρ/N = 2.0/3 = 0.667 < 1 so we can use the other equations • P0 = 1/(20/0! + 21/1! + 22/2! + 23/3!(1-2/3)) = 0.1111 • Q-bar = (0.1111)(24)/(3!*3)*(1/(1 – 2/3)2) = 0.88 people • W-bar = 0.072 – 1/20 = 0.022 minutes = 1.32 seconds
Example 3 You are now inside the Arena. They are passing out Harry the Husky doggy bags as a free giveaway. There is only one person passing these out and a line has formed behind her. It takes her exactly 6 seconds to hand out a doggy bag and the arrival rate averages 9 people/minute. Find the average length of queue, average waiting time in queue, and average time spent in the system assuming M/D/1 queuing.
Example 3 • N = 1 • Departure rate: μ = 6 seconds/person or 10 persons/minute • Arrival rate: λ = 9 persons/minute • ρ = 9/10 = 0.9 • Q-bar = (0.9)2/(2(1 – 0.9)) = 4.05 people • W-bar = 0.9/(2(10)(1 – 0.9)) = 0.45 minutes = 27 seconds • T-bar = (2 – 0.9)/((2(10)(1 – 0.9) = 0.55 minutes = 33 seconds
Course logistics • Projects returned Wednesday • HW5 due today • Kelly to lecture Wednesday • No class Friday • Kelly OH tomorrow • Prof. Goodchild no OH Thursday • HW6 due November 3
Performance Management CEE 320Anne Goodchild
I-5 Average Daily Traffic from the WSDOT 2001 Annual Traffic Report
Freeway Defined • A divided highway with full control of access and two or more lanes for the exclusive use of traffic in each direction.
Definitions – Flow Characteristics • Undersaturated • Traffic flow that is unaffected by upstream or downstream conditions. • Queue discharge • Traffic flow that has just passed through a bottleneck • Oversaturated • Traffic flow that is influencedby the effects of a downstream bottleneck.
Speed vs. Flow SfFree Flow Speed Uncongested Flow Sm Speed (mph) Optimal flow, capacity, vm Congested Flow Flow (veh/hr)
Metrics for measurement • Average speed • Variance • How to provide a measurement for a region?
Definitions – Free-Flow Speed • Free-Flow Speed (FFS) • The mean speed of passenger cars that can be accommodated under low to moderate flow rates on a uniform freeway segment under prevailing roadway and traffic conditions. • Factors affecting free-flow speed • Lane width • Lateral clearance • Number of lanes • Interchange density • Geometric design
Definitions • Passenger car equivalents • Trucks and RVs behave differently • Baseline is a freeway with all passenger cars • Traffic is expressed in passenger cars per lane per hour (pc/ln/hr or pcplph) • Driver population • Non-commuters suck more at driving • They may affect capacity • Capacity • Corresponds to LOS E and v/c = 1.0
Definitions – Level of Service (LOS) • Chief measure of “quality of service” • Describes operational conditions within a traffic stream. • Does not include safety • Different measures for different facilities • Six measures (A through F) • Used for performance analysis, investment decisions • Freeway LOS • Based on traffic density • Assumptions for freeway segment • No interaction with adjacent facilities (streets, other freeways) • Free-flow conditions exist on either side of the facility being analyzed • Outside the influence or ramps and weaving areas
Definitions • Freeway Capacity • The maximum sustained 15-min flow rate, expressed in passenger cars per hour per lane, that can be accommodated by a uniform freeway segment under prevailing traffic and roadway conditions in one direction of flow.
LOS A Free-flow operation LOS B Reasonably free flow Ability to maneuver is only slightly restricted Effects of minor incidents still easily absorbed Levels of Service From Highway Capacity Manual, 2000
LOS C Speeds at or near FFS Freedom to maneuver is noticeably restricted Queues may form behind any significant blockage. LOS D Speeds decline slightly with increasing flows Density increases more quickly Freedom to maneuver is more noticeably limited Minor incidents create queuing Levels of Service From Highway Capacity Manual, 2000
LOS E Operation near or at capacity No usable gaps in the traffic stream Operations extremely volatile Any disruption causes queuing LOS F Breakdown in flow Queues form behind breakdown points Demand > capacity Levels of Service From Highway Capacity Manual, 2000
Performance comparison • Different for different types of roadways • Arterial • Highway • Local streets • Bridges • Rural roads • Mountain roads • …..
TTI Urban Mobility Report • http://mobility.tamu.edu/ums/congestion_data/national_congestion_tables.stm • http://ops.fhwa.dot.gov/congestion_report_04/appendix_C.htm
Travel time index • the ratio of average peak travel time to a free-flow travel time (in this report, the travel time at 60 mph for freeways). For example, a value of 1.20 means that average peak travel times are 20 percent longer than free-flow travel times.
Percent of congested travel • the ratio of congested travel to total travel. The analysis uses vehicle-miles of travel (VMT); person-miles of travel could also be used if person flows are of interest and widely available. The percent of congested travel is a relative measure of the amount of travel affected by congestion.
Delay • the additional travel time that is incurred when actual travel times are greater than free-flow travel times. The delay is expressed in several different ways, including total delay in vehicle-hours, total delay per 1,000 VMT, and share of delay by time period, day of week, or speed range.
Buffer index • the extra time (buffer) most travelers add to their average travel time when planning trips. For example, a buffer index of 40 percent means that a traveler should budget an additional 8-minute buffer for a 20-minute average peak travel time to ensure on-time arrival most of the time (95 percent in this report).
Planning time index • Statistically defined as the 95th percentile travel time index, this measure also represents the extra time most travelers add to a free-flow travel time when planning trips. For example, a planning time index of 1.60 means that travelers plan for an additional 60 percent travel time above the free-flow travel time to ensure on-time arrival most of the time (95 percent in this report).