Download
1 / 18
180 likes | 336 Views
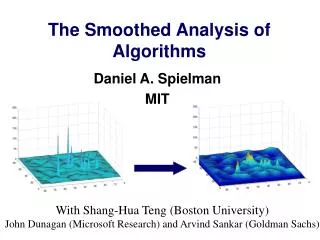
Smoothed Maps. This is a Smoothed Map. Ideas Behind Smoothing. To avoid arbitrary political boundaries To adjust unstable estimates towards a global mean To borrow strength from neighboring areas. Spatial Smoothing Techniques. Rates/RRs in disjoint areas such as counties Empirical Bayes

E N D
Ideas Behind Smoothing • To avoid arbitrary political boundaries • To adjust unstable estimates towards a global mean • To borrow strength from neighboring areas
Spatial Smoothing Techniques • Rates/RRs in disjoint areas such as counties • Empirical Bayes • Headbanging • Spatial Filters / Kernel Smoothers All techniques may be used for rates, proportions or relative risks. The latter also for probabilities.
Empirical Bayes Global smoothers adjust each area estimate towards a global mean. Local smoothers adjust each area estimate up or down depending on the data in neighboring areas. Review: Devine OJ, Louis TA, Halloran ME. Empirical Bayes methods for stabilizing incidence rates before mapping. Epidemiology, 5:622-630, 1994.
Headbanging Adjusts estimates in an area by borrowing strength from neighbouring areas. Hansen KM. Headbanging: Robust smoothing in the plane. IEEE Transactions on Geoscience and Remote Sensing, 29:369-378, 1991. Mungiole M, Pickle LW, Simonson KH. Application of a weighted head-banging algorithm to mortality data maps. Statistics in Medicine, 18:3201, 1999.
Spatial Filters / Kernel Smoothers Calculates rates / RRs in multiple overlapping circular areas. The rate / RRs for each circle is depicted at the center of that circle.
x x x x x x x x x x x x x x x x x x x
Spatial Filters / Kernel Smoothers Larger Circles = More smoothing and more stable estimates Smaller Circles = Less smoothing but higher geographical resolution
Spatial Filters / Kernel Smoothers Circles of fixed geographical size provides equal geographical resolution across the map. Circles of fixed population size provides equally reliable estimates across the map.
Spatial Filters / Kernel Smoothers Rather than a simple circle, one can use a kernel with a higher weight in the center and gradually lower weights further away as one moves away from the center.
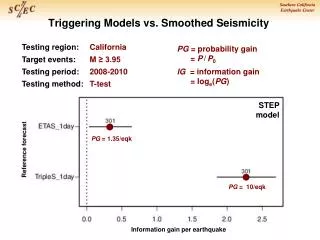
Smoothed Probability Maps Provides contours of p-values
Low Birth Weight in Des Moines, Iowa Rushton & Lolonis Statistics in Medicine 1996
Spatial Filters / Kernel Smoothers References Kafadar K. Smoothing geographical data, particularly rates of disease. Statistics in Medicine, 15:2539-2560, 1996. Rushton G, Lolonis P. Exploratory spatial analysis of birth defect rates in an urban population. Statistics in Medicine, 15:717-726, 1996. Talbot TO, et al. Evaluation of spatial filters to create smoothed maps of health data. Statistics in Medicine, 19:2399-2408, 2000.
Exploratory/Descriptive Techniques • Maps of rates or relative risks • Probability maps • Smoothed rates or relative risks • Smoothed probability maps
Maps of rates and probability maps are very useful for descriptive purposes Problem Maps of Rates: No statistical testing Probability Maps: Multiple testing Solution Tests for Spatial Randomness: One test