Download
1 / 19
200 likes | 310 Views
2012 ISOE Asian ALARA Symposium September 24- 25, 2012, JNES, Tokyo Japan. Occupational Exposure at Japanese Nuclear Power Plants. Yoshihisa HAYASHIDA Japan Nuclear Energy Safety Organization (JNES). Nuclear Power Plants in Japan. as of March 31, 2012. Oma.

E N D
2012 ISOE Asian ALARA Symposium September 24- 25, 2012, JNES, Tokyo Japan Occupational Exposure at Japanese Nuclear Power Plants Yoshihisa HAYASHIDA Japan Nuclear Energy Safety Organization (JNES)
Nuclear Power Plants in Japan as of March 31, 2012
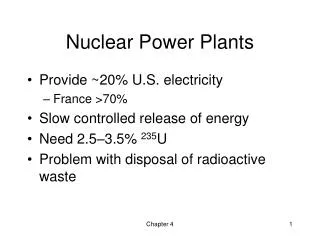
Oma 55 Units in Operation (PWR 23, BWR 32) as of March 31, 2006 Shika 志賀 Namie-Odaka ふげん Fugen Tomari 2 2 (2003 ) 年より廃止措置準備中 (on a decommissioning stage since 2003) Kashiwazaki-kariwa Higashi Dori Higashi Dori TEPCO Onagawa 女川 Tsuruga 敦賀 2 1 1 Fukushima Daiichi 福島第一 Mihama 8 8 7 7 Fukushima Daini Ohi Tokai Takahama (On the decommissioning stage since 1998) Tokai No. 2 3 Shimane Hamaoka Kaminoseki 5 5 5 5 5 6 (Unit 1,2On the decommissioning stage since 2009) Ikata Genkai Sendai In operation 3 Under Construction 出力規模 Output scale On planning stage Total 50 Units 46,148MWe (PWR 24 units, BWR 26 units ) 合計 53 基 出力 47,122MWe Less than More than 50 kW 万 未満 Less than 100 kW 100 kW 万 未満 万 以上 500,000kW 1,000,000kW 1,000,000kW Nuclear Power Plants in Japan (Unit 1,2,3,4: On the decommissioning stage)
Average Individual Dose in Fiscal Year 2011(April 2011 – March 2012) 1. Includes Hamaoka 1 & 2 under decommissioning, and dose not include Fukushima Daiichi (6 BWR)and Fukushima Daini (4 BWR)
Collective Dose in Fiscal Year 2011 (April 2011 – March 2012) 1. Includes Hamaoka 1 & 2 under decommissioning, and dose not include Fukushima Daiichi (6 BWR)and Fukushima Daini (4 BWR)
Trend of Average Collective Dose per Reactorand Capacity Factor
Trend of Capacity Factor by Month(January 2011 – August 2012)
BWR Average Collective Dose per Reactor by Country(1980-2011) *) Dose data exclude Fukushima Daiichi for FY 2010, and Fukushima Daiichi and Fukushima Daini for FY 2011.
PWR Average Collective Dose per Reactor by Country(1980-2011)
Contribution of outage collective dose to annual collective dose (5-year average)
Comparison of outage collective dose between conventional type and improved type(LWR) Conventional type: Plant before 1982 Improved type: Plant after 1983 Average Collective Dose
Comparison of outage collective dose between conventional type and improved type(BWR) Conventional type: Plant before 1982 Improved type: Plant after 1983 Average Collective Dose
Comparison of outage collective dose between conventional type and improved type(PWR) Conventional type: Plant before 1982 Improved type: Plant after 1983 Average Collective Dose
Correlation between Elapsed time after commencement of commercial operation and Exposure per outage (Japanese BWR)
Correlation between Elapsed time after commencement of commercial operation and Exposure per outage (Japanese PWR)