Download
1 / 44
440 likes | 445 Views
Precipitation Intensity. Climate Impacts Group & Department of Atmospheric Sciences University of Washington. Eric Salathé. Climate Change: North America. Winter. Summer. Annual. Climate Change: Pacific Northwest Precipitation.

E N D
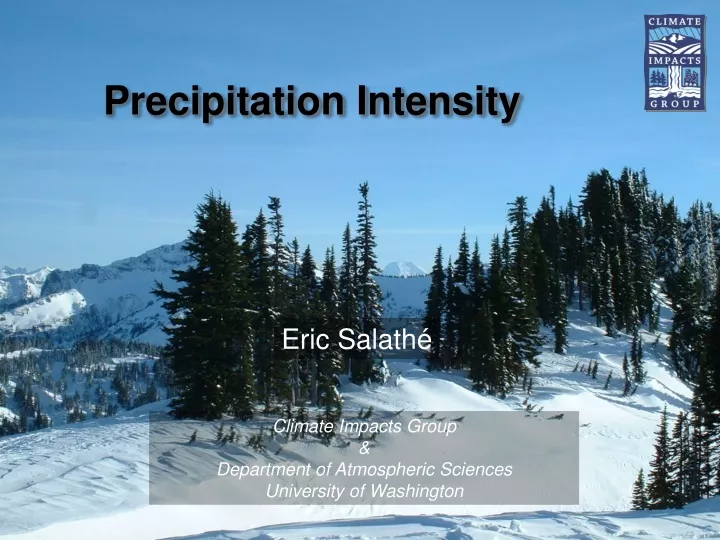
Precipitation Intensity Climate Impacts Group&Department of Atmospheric SciencesUniversity of Washington Eric Salathé
Climate Change: North America Winter Summer Annual
Climate Change: Pacific Northwest Precipitation Change in U.S. PNW precipitation by monthfrom 1990s to futuresimulated by 20 climate models Precipitation Change (%)
Changes in Pacific Storm Track • Consensus of current Global Climate Models: • Intensification of Mid-latitude storms • Less frequent storms • Northward shift in storm track
Shift in Pacific Storm Track J Yin, Geophys Res Lett, 2005 Temperature Change 1980-2000 to 2080-2100 Change in Storm Growth S Pole EQ N Pole S Pole EQ N Pole
Shift in Pacific Storm Track 1950-2000 to 2050-2100 Nov-Dec-Jan 20th Century Model Composite Observed (NCEP-NCAR Reanalysis) 21st Century Model Composite Salathé, Geophys Res Lett, 2006
Shift in Aleutian Low 1950-2000 to 2050-2100 Nov-Dec-Jan Observed 20th Century Model Composite Salathé, Geophys Res Lett, 2006
Movement of Jetstream 1950s
Movement of Jetstream 1960s
Movement of Jetstream 1970s
Movement of Jetstream 1980s
Movement of Jetstream 1990s
Movement of Jetstream 1950s
Are extreme rain events becoming more frequent? Valérie Dulière, Philip Mote, Eric Salathé, Josiah Mault and Marketa McGuire Elsner (Climate Impacts Group, University of Washington) 2008 Pacific Northwest Weather Workshop Source : THE OREGONIAN/Bruce Ely
The Chehalis River flooding Source : THE OREGONIAN/Bruce Ely
The Centralia station Distribution function of daily precipitations from 1948 to 2006 5 cm 10 cm
The Centralia station Distribution function of daily precipitations from 1948 to 2006 (Zoom) 5 cm 10 cm
The Centralia station Distribution function of daily precipitations from 1948 to 2006 (Zoom) 1994, 1986 1951, 1981 1986 2006 1990 1990 1986 1996 2001 5 cm 10 cm
The Centralia station Distribution function of daily precipitations from 1948 to 2006 (Zoom) Since 1948, 80% of the 20 greatest extreme daily rain events occurred after 1985! 1994, 1986 1951, 1981 1986 2006 1990 1990 1986 1996 2001 5 cm 10 cm
3.3 in 2.5 yr The Centralia station Return period of annual maximum daily precipitation --1948-1976 --1977-2006
The Past 50 Years Source : THE OREGONIAN/Bruce Ely
The Centralia station Return period of annual maximum daily precipitation 10-year Return } Percent Change --1948-1976 --1977-2006
Percentages of change in the annual maximum daily precipitation with a 10 years return period for each station 1 2 3 4 5 6 7 8 9 10
1 2 7 3 4 5 6 10 8 9
What Do Climate Models Project for the Future? Source : THE OREGONIAN/Bruce Ely
Projected Future Changes from Climate Models (2046-2065 versus 1981-2000)
Projected Future Changes from Climate Models (2046-2065 versus 1981-2000) SRES A1B SRES B1 IPSL ECHAM5 CCSM3 Percentages of change in the annual maximum daily precipitation with a 10 years return period for each grid cell between 1981-2000 and 2046-2065.
Projected Future Changes from Climate Models (2046-2065 versus 1981-2000) SRES A1B SRES B1 IPSL +18.8% +11.8% ECHAM5 CCSM3 Percentages of change in the annual maximum daily precipitation with a 10 years return period for each grid cell between 1981-2000 and 2046-2065.
Projected Future Changes from Climate Models (2046-2065 versus 1981-2000) SRES A1B SRES B1 IPSL +18.8% +11.8% ECHAM5 +11.4% +10.6% CCSM3 Percentages of change in the annual maximum daily precipitation with a 10 years return period for each grid cell between 1981-2000 and 2046-2065.
Projected Future Changes from Climate Models (2046-2065 versus 1981-2000) SRES A1B SRES B1 IPSL +18.8% +11.8% ECHAM5 +11.4% +10.6% CCSM3 +12.2% +10.8% Percentages of change in the annual maximum daily precipitation with a 10 years return period for each grid cell between 1981-2000 and 2046-2065.
Projected Future Changes from Climate Models (2046-2065 versus 1981-2000) Number of days per year with P > 0.4 inches Number of days per year
Number of days per year with P > 0.4 inches P > 1.6 inches Number of days per year
Projected Future Changes from Climate Models (2046-2065 versus 1981-2000) Number of days per year with P > 0.4 inches P > 1.6 inches P > 2.8 inches Number of days per year
GOING TO THE EXTREMES • GOING TO THE EXTREMESAN INTERCOMPARISON OF MODEL-SIMULATED HISTORICAL AND FUTURE CHANGES IN EXTREME EVENTS CLAUDIA TEBALDI , KATHARINE HAYHOE, JULIE M. ARBLASTER and GERALD A. MEEHL, Climatic Change (2006) 79: 185-211 • 9 Global Model Simulations for IPCC • 1. Number of days with precipitation greater than 10 mm (precip > 10). • 2. Maximum number of consecutive dry days (dry days). • 3. Maximum 5-day precipitation total (5 day precip). • 4. Simple daily intensity index, defined as the annual total precipitation divided by the number of wet days (precip intensity). • 5. Fraction of total precipitation due to events exceeding the 95th percentile of the climatological distribution for wet day amounts (precip > 95th).
Mesoscale Effects • Global models do not resolve fine-scale processes such as topographic precipitation • Downscaling methods are used to account for regional effects • Statistical downscaling uses observed relationship between large-scale and fine-scale patterns to extrapolate to climate model results • Regional climate model simulates fine-scale physical processes
Change in Orographic Enhancement 1990-2000 to 2045-2055 Sept-Oct-Nov Downscaling without wind effect Downscaling with wind effect Salathé, Geophys Res Lett, 2006
Mesoscale Climate Model • Based on Regional Weather Model (MM5, WRF) • Nested grids 135-45-15 km • Advanced land-surface model (NOAH) with interactive deep soil temperature • Global Climate Model used as Input (boundary conditions)
Autumn Precipitation Changes Change in Orographic Enhancement Change in Autumn precipitation rate from 1990s to 2050sas simulated in regional climate model WindsShift toOnshore Rain increases along mountain ridge mm per day
MM5 vs Statistical Downscaling Statistical Downscaling MM5 P only P & Wind Change in November Precip (mm/day) 1990s to 2050s
Conclusions : • This is the beginning of our work. • According to the observations from the COOP network, extreme rain events have globally increased in frequency and intensity between 1948-1976 and 1977-2006 over the Washington state. • According to global climate models (IPSL, ECHAM5 and CCSM3), extreme rain events will in average be more intense and more frequent in 2046-2065 than now, over the PNW region. Coming next : Analysis of output from regional climate models. Source : http://www.earthcam.com/