Download
1 / 13
640 likes | 1.82k Views
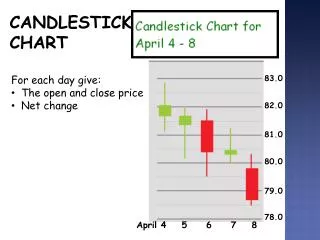
Candlestick pattern is a movement in prices of script shown graphically on the candlestick chart. By looking at this movement of prices over time period for particular script (candlestick pattern), anyone can predict the movement of the market. There are different 42 types of recognised candlestick patterns. But only few of them are well known.

E N D
Candlestick pattern is a movement in prices of script shown graphically on the candlestick chart. By looking at this movement of prices over time period for particular scrip (candlestick pattern), anyone can predict the movement of the market. There are different 42 types of recognized candlestick patterns. But only few of them are well known. Candlestick Patterns http://www.nsedata.com Mobile No: 07405200012
Bullish piercing Bullish Engulf Hammer Morning Star Bearish Piercing Bearish Engulf Inverted Hammer Evening Star Hanging Man Types of Candlesticks Patterns http://www.nsedata.com Mobile No: 07405200012
Bullish piercing pattern consist of two candles. One is bearish red candle and another is bullish green candle. In bullish piercing pattern green candle opens below the previous red candles and closes at the middle of the previous red candle. Bullish piercing pattern can occur at any time like at the beginning of trend or at the end of the trend or during the trend. Bullish piercing http://www.nsedata.com Mobile No: 07405200012
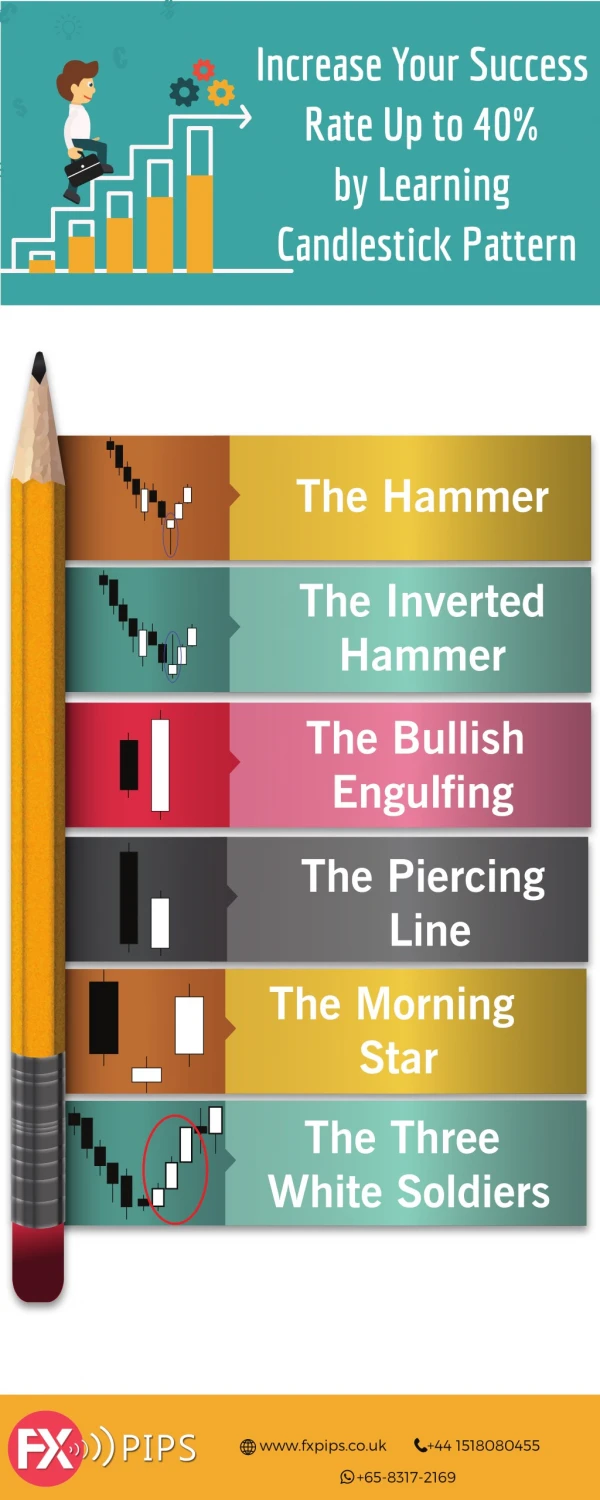
Bullish Engulf pattern consist of two candlestick, one is smaller bearish candle and another is large bullish candle. The bearish candle real body of Day 1 is usually contained within the real body of the bullish candle of Day 2. In bullish engulf pattern market starts with gap down on day 2, bullish candle pushes prices higher and fill the gap down from the morning’s opening and take the prices higher than the previous day’s open. Usually we can see bullish engulf pattern at the end of the down trend. Bullish Engulf http://www.nsedata.com Mobile No: 07405200012
The Hammer candlestick formation is a significant bullish reversal candlestick pattern. Hammer candle stick pattern mainly occurs at the bottom of downtrends. Hammer pattern gets shape when open, high and close prices are nearly equal to same. Hammer http://www.nsedata.com Mobile No: 07405200012
Morning star consist of three candles, one is large bearish candle second is bullish or bearish candle or third is large bullish candle. Morning star usually occurs at the end of the down trend. In morning star pattern first candle is bearish candle which makes a new loss. Second candle opens with gap down and candle stick on day 2 is quite small and can be bullish or bearish. On day 3, candle open up with gap up and it is a bullish green colored candle. Morning Star http://www.nsedata.com Mobile No: 07405200012
Bearish piercing pattern indicates the end of up trend and fall of price. Bearish piercing pattern is made up of two candles one has green body and small wick at both ends. The candle for second day is red bodied candle and opens up higher than previous day candle. One important note for this pattern is, second day candle ends up at or below the middle of the previous candle. If it isn’t, this may be minor changes in prices Bearish Piercing http://www.nsedata.com Mobile No: 07405200012
Bearish engulf pattern is bearish reversal pattern and usually occur at the top of the up trend. Bearish engulf pattern consist of two candle sticks one is small bullish green colored and other one is large bearish red colored candle. In bearish engulf pattern, second day’s candle opens with gap up and takes prices down below the previous candle. Bearish Engulf http://www.nsedata.com Mobile No: 07405200012
The Inverted Hammer candlestick formation occurs mainly at the bottom of downtrends and is a warning of a potential reversal upward. Inverted candle pattern occurs when open low close prices are nearly equal to same. In inverted hammer candle stick pattern there is long wick which is two times larger than the actual body part of the candle. Inverted hammer pattern occurs at the end down trend. This pattern indicates potential reversal upward and price changes. When low and open are same bullish inverted hammer pattern is formed and when low and close bearish pattern is formed. Inverted Hammer http://www.nsedata.com Mobile No: 07405200012
Evening star pattern occurs at the top of an up trend. It consist of three candles one is large bullish, second is small bullish or bearish and third is large bearish candle. Evening Star http://www.nsedata.com Mobile No: 07405200012
The hanging man candle stick pattern is just like hammer formation. Patterns occur mainly at the top of the up trend and it indicates the potential reversal down trend. Hanging man pattern is same as hammer pattern this pattern occurs when open low close are roughly the same price. There is a long wick which is two times longer than body part. When the high and open prices are same, a bearish hanging man pattern is formed and when the high and close prices are same bullish hanging man pattern is formed. Hanging Man http://www.nsedata.com Mobile No: 07405200012
Follow Us http://www.nsedata.com Mobile No: 07405200012
Please visit website www.nsedata.com for more details. Thank You http://www.nsedata.com Mobile No: 07405200012