Download
1 / 53
530 likes | 687 Views
Genome Biology and Biotechnology. 8. The transcriptome. Prof. M. Zabeau Department of Plant Systems Biology Flanders Interuniversity Institute for Biotechnology (VIB) University of Gent International course 2005. Functional Maps or “-omes”. Genes or proteins.

E N D
Genome Biology and Biotechnology 8. The transcriptome Prof. M. Zabeau Department of Plant Systems Biology Flanders Interuniversity Institute for Biotechnology (VIB) University of Gent International course 2005
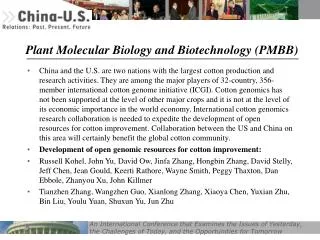
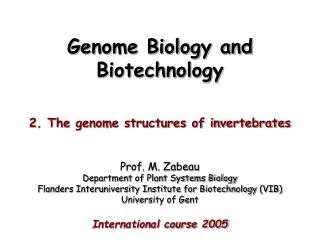
Functional Mapsor “-omes” Genes or proteins 1 2 3 4 5 n “Conditions” Genes ORFeome Mutational phenotypes Phenome Transcriptome Expression profiles DNA Interactome Protein-DNA interactions Localizome Cellular, tissue location Interactome Protein interactions Proteome proteins After: Vidal M., Cell, 104, 333 (2001)
Summary • Transcriptome mapping • Identification of transcribed regions in the genome • Experimental confirmation of predicted gene models • Discovery of non-coding RNA genes • The “evolving” transcriptome map shows that • The genome contains many more “genes” than simply genes coding for proteins • Transcriptome profiling • Functional characterization of genes based on expression patterns • Cluster analysis of expression patterns • Identification of co-regulated gene clusters • Classification of tumors
Transcriptome mapping platforms • Large scale EST sequencing • Primarily used to identify protein coding genes • Noisy data sets that have been difficult to interpret • Large scale full-length cDNA sequencing • Technically very difficult and laborious • Limited to a few model organisms: mouse and human • Microarray technologies • Become increasingly powerful as the density of the microarrays has increased tremendously • Providing the most detailed view of the transcribed regions in the genome
EST Sequencing • 3’ or 5’ ESTs sequences of individual cDNA clones • cDNAs are often truncated at the 5’ end (not full length) • Typically done on 5.000 to 10.000 clones per library • Identifies the 1000 to 2000 most abundantly expressed genes • Identifying ~70% of the protein coding genes requires • Sequencing several 10s or even 100s of libraries • Typically EST data bases contain >200.000 to 500.000 ESTs • EST sequence assemblies yield unigene collections • Clusters of overlapping sequence reads from the same gene 5’EST poly A vector vector Cloned cDNA 3’EST
Full length cDNA Sequencing • Technically very challenging • Special techniques for selecting full length cDNA clones • 5’ end (Capped end) selection • Aggressive subtraction/normalization required to cover “all” genes • Mouse and human “FANTOM” full length cDNA libraries • Large scale sequencing of >> million 5' end and 3'-end sequences • Complete sequencing of >100.000 full length cDNA clones • Full length cDNAs define transcriptional units (TU) • segments of the genome from which transcripts are generated • TUs are DNA strand-specific, and are typically bounded by promoters at one end and termination sequences at the other
Transcriptional Units • Transcriptional units (TUs) comprise • Protein coding transcripts (genes) and non-coding transcripts (genes?) • Alternatively spliced transcripts • Transcripts with alternative 5' start • Transcripts with alternative 3' ends • Frequently transcripts are made from both strands • Sense and antisense transcripts • are considered to be made from separate TUs • The transcriptome is much more complex than we have always thought! Reprinted from: The FANTOM consortium, Nature 420, 563 - 573 (2002)
The complexity of the transcriptome Sense transcripts Protein coding transcripts Anti-sense transcripts Non-protein coding transcripts
Mouse transcriptome • The FANTOM 2 transcriptome • 60,770 completely sequenced clones • comprises ~37.000 TUs • ~60% coding transcripts (~20.500 genes) • ~40% non coding transcripts (~16.500 new genes) • 29% are spliced • Typical polyadenylation sites: RNA Pol II-mediated transcription • Many are antisense transcripts to coding transcripts • Estimate of the complete mouse transcriptome • 70.000 transcriptional units • 40.000 coding transcriptional units(>23.000 protein coding genes?) • 30.000 non-coding transcriptional units Reprinted from: The FANTOM consortium, Nature 420, 563 - 573 (2002)
Experimental annotation of the human genome using microarray technology • Microarrays with 2 probes for each predicted exon • Hybridized with a total of 69 cDNA samples • Gene validation based on correlated exon expression Reprinted from: Shoemaker et. al., Nature 409, 922 (2001)
Analysis of Chromosome 22 genes correct Incorrect exon Merged genes Ab initio correct Reprinted from: Shoemaker et. al., Nature 409, 922 (2001)
The transcriptional activity of human Chromosome 22 • Paper describes • Global transcriptional activity in placental RNA using • DNA microarrays of 19,525 PCR fragments (300 bp to 1.4 kb)representing nearly all of the unique (nonrepetitive) sequences of human Chromosome 22 Rinn et al., Genes & Dev. 17: 529-540 (2003) Array design 0 1.000 2.000 bp probes Average exon
The human Chr 22 placental transcriptome Novel gene Transcription PCR probes Annotated genes Annotated gene Reprinted from: Rinn et al., Genes & Dev. 17: 529-540 (2003)
The human Chr 22 placental transcriptome • Twice as many sequences are transcribed than previously reported • Equal number of transcribed sequences in unannotated regions as in annotated regions • Transcripts from unannotated regions comprise • transcripts internal to annotated introns • transcripts that are antisense to annotated genes • a large portion of the novel transcripts is evolutionarily conserved in the mouse Reprinted from: Rinn et al., Genes & Dev. 17: 529-540 (2003)
Novel RNAs Identified From an In-Depth Analysis of the Transcriptome of Human Chromosomes 21 and 22 • Paper describes • Transcriptome analysis of nonrepetitive regions of chromosomes 21 and 22 in 11 different cell lines using • High density oligonucleotide arrays with a 35 bp resolution • uniformly spaced 25-mers oligonucleotide probes Kampa et. al., Genome Res. 13: 331-342 (2003) Array design 0 500 1.000 bp probes Average exon
Transcription maps based on adjacent probesintensities • Transfrags • adjacent probes detecting transcripts • Well-annotated genes • 80% to 90% of the known genes show alternative splicing Reprinted from: Kampa et. al., Genome Res. 13: 331-342 (2003)
Transcriptome maps of Chr 21 and 22 • 50% of the transcription falls outside known genes • 75% contain no ORFs and are thus non-coding • ~10% is antisense to known genes • Transcriptome is greater than previously estimated • the total number of transcripts is much larger than the present estimates of 25,000 genes Reprinted from: Kampa et. al., Genome Res. 13: 331-342 (2003)
Global Identification of Human Transcribed Sequences with Genome Tiling Arrays Bertone et. al., Science 306, 2242-2246 (2004) • Paper presents • Transcriptome analysis of the nonrepetitive regions of the human genome in human liver tissue RNA using • High density oligonucleotide arrays with a 46 bp resolution • uniformly spaced 36-mer oligonucleotide probes • A total of 51,874,388 36-mer probes • representing 1.5 Gb of nonrepetitive human genomic DNA Array design 0 500 1.000 bp probes sense anti-sense Average exon
Annotated genes aligned with microarray fluorescence intensities probes Exon/intron probes Exon/intron Reprinted from: Bertone et. al., Science 306, 2242-2246 (2004)
Identification of Novel Transcription Units • Novel transcription units • Transcribed regions outside of previously annotated exons • Identified 8958 novel transcription units • Over half were distal to annotated genes • Many transcription units are homologous to mouse genome sequences Reprinted from: Bertone et. al., Science 306, 2242-2246 (2004)
Transcriptional Maps of 10 Human Chromosomes at 5-Nucleotide Resolution Cheng et. al., Science. 308: 1149-1154 (2005) • Paper presents • Transcriptome analysis of the nonrepetitive regions of the 10 human chromosomes (30% of the genome) in 8 cell lines RNA using • Ultra high density oligonucleotide arrays with a 5 bp resolution • Tiling array of 25-mer oligonucleotide probes with a 20 bp overlap Array design 0 500 1.000 bp probes Average exon
Correlation of poly A+ transcripts to annotations • Larger amount of transcripts • 57% novel transcripts in unannotated regions • Intergenic and intronic • Novel transcripts frequently • overlap with other transcripts • spliced Reprinted from: Cheng et. al., Science. 308: 1149-1154 (2005)
Poly A+ and poly A– transcription in the nucleus and cytosol • Analysis of poly A+ and poly A– transcripts • poly A– transcripts are twice as abundant as poly A+ • A large proportion of the transcripts is found exclusively in the nucleus or the cytoplasm cytoplasm Poly A+ Poly A- nucleus Reprinted from: Cheng et. al., Science. 308: 1149-1154 (2005)
Conclusions • Transcriptome mapping experiments show that • a larger percentage of the genome is transcribed than can be accounted for by the current state of genome annotations • The human transcriptome is composed of • a network of overlapping transcripts (> 50% of the transcripts) • Poly A– RNAs potentially comprise almost half of the human transcriptome • Our understanding of the human transcriptome is still evolving… • What are the functions of the non-coding transcripts? Reprinted from: Cheng et. al., Science. 308: 1149-1154 (2005)
The complexity of the transcriptome Reprinted from: Mattick, Science. 309: 1527-1528 (2005)
A Gene Expression Map for the Euchromatic Genome of Drosophila melanogaster Stolc et. al., Science, 306, 655-660 (2004) • Paper presents • Transcriptome map of the Drosophila genome • using microarrays with 179,972 unique 36-nucleotide probes • 61,371 exon probes for the 13,197 predicted genes • 30,787 splice junction probes • 87,814 nonexon probes from intronic and intergenic regions • Using RNA from six developmental stages during the Drosophila life cycle
Genomic expression patterns • 93% of all annotated gene were significantly expressed • confirmed 2426 annotated genes not yet validated through an EST sequence • The majority of the genes are developmentally regulated Reprinted from: Stolc et. al., Science, 306, 655-660 (2004)
Transcriptome map of Drosophila • 41% of intergenic and intronic probes are expressed • One fraction does not correspond to exons and may represent putative noncoding transcription units • 15% of the intergenic and intronic probes are developmentally regulated • Alternative splicing • 53% of expressed Drosophila genes exhibit exon skipping • 46% of genes showed multiple patterns of exon expression suggesting alternativesplicing or alternative promoter usage • Alternative splicing in Drosophila • Much higher than previously estimated Reprinted from: Bertone et. al., Science 306, 2242-2246 (2004)
Transcriptome or Gene Expression Profiles • The transcriptome is dynamic • Changes rapidly and dramatically in response to perturbations, environmental stimuli or during normal cellular events • Changes in the patterns of gene expression provide clues about • cellular functions • biochemical pathways • regulatory mechanisms • Transcriptome or gene expression profiling aims to • Monitor the expression levels of “all” genes • Correlate expression profiles with biological activity • Identifying genetic networks and pathways • Identifying the function of unknown genes • Diagnose physiological (disease) states Reprinted from: Lockhart and Winzeler, Nature 405, 827 (2000)
Eukaryotic Transcriptome Reprinted from: “The Cell ”
Transcriptome Profiling Platforms • DNA sequencing based methods • DNA sequencing of individual cDNA clones to count the number of times a cDNA clone is present in a cDNA library • Limited resolution but measures absolute RNA levels • DNA fragment analysis based methods • PCR-based amplification of DNA fragments derived from mRNA or cDNA whereby • Each DNA fragment represents a different mRNA • Currently primarily used for not (yet) sequenced species • Array-based hybridization methods • Hybridization to microarrays with gene-specific DNA probes • Has become the most performant and most widely used platform • High resolution exon microarrays allow quantitative analysis of alternatively spliced transcripts
Cluster Analysis and Display of Genome-wide Expression Patterns • Paper presents • Method for analyzing and representinggenome-wide expression data • Cluster analysis of data using standardstatistical algorithms to arrange genes according to similarityin pattern of gene expression • The output is displayed graphically,conveying the clustering and the expression data simultaneouslyin a form intuitive for biologists Eisen et. Al., PNAS 95, 14863 (1998)
Cluster Analysis of Expression Patterns • A logical basis for organizing gene expression data is to group genes with similar patterns of expression • using a mathematical description of similarity that captures • similarity in "shape" of expression profiles • Since there is no a priori knowledge of gene expression patterns, unsupervised methods are favored • Pair wise average-linkage cluster analysis - a form of hierarchical clustering - similar to that used in sequence and phylogenetic analysis • Yields a similarity tree: branch lengths reflect the degreeof similarity between the objects Reprinted from: Eisen et. Al., PNAS95, 14863 (1998)
Example: Similarity Tree of CDK Genes 0.1 Ms_CDKB1_1_MsD CDC2b-like_VERO At_CDKB1_1_BAA01624.1 Le_CDKB1_1_CAC15503.1 Le_CDKb2_1_CAC15504.1 Ms_cdc2F_CAA65982.1 CDC2FbAt_VERO CDC2FaAt_VERO At_CDKA_2_AAA32831.1 Ms_CDKA_2_CAA50038.1 Ms_CDKA_1_AAB41817.1 Ms_CDKE_1_CAA65981.1 put35prot_AT5_5_4281-5693_prot Ms_CDKC_1_CAA65979.1 putCDKC2_T42526 At_CDKC_2 At_CDKC_1 put10Cprot.tfa CAK1AT_BAA28775.1 put4CAK_AT1_4_3436-5676_prot Os_CDKD_1_CAKR2_CAA4117 put5CAK_OK
GraphicalRepresentation • Combines clustering with a graphicalrepresentation of the primary data • By representing each data pointwith a color that is a quantitative reflection of theexperimental observations • Green: down regulated • Red: up regulated • Images show contiguous patchesof color • Representing groups of genes that share similar expressionpatterns over multiple conditions • Analysis of clustered genes shows that • The clustered genes share common functions in cellular processes Reprinted from: Eisen et. Al., PNAS95, 14863 (1998)
GraphicalRepresentation Different experimental observations Cluster 1 Different genes Cluster 2 Reprinted from: Eisen et. Al., PNAS 95, 14863 (1998)
Cluster Analysis of Combined Yeast Data Sets • Synchronized cell division • Sporulation • Heath shock • Reducing agents • Low temperature Reprinted from: Eisen et. Al., PNAS 95, 14863 (1998)
Genes of Similar Function Cluster Together Ribosomal proteins Histones Reprinted from: Eisen et. Al., PNAS 95, 14863 (1998)
Global Analysis of the Genetic Network Controlling a Bacterial Cell Cycle • Paper presents • full-genome evidence that bacterial cells use discrete transcription patterns to control cell division • Demonstrating that genes involved ina given cell function are activated at the time of execution ofthat function Laub et. Al., Science, 290, 5499 (2000)
Cell division in the bacterium Caulobacter crescentus • A complex genetic network controls cell division • DNA replication and the ordered biogenesis of cell structures Reprinted from: Laub et. Al., Science, 290, 5499 (2000)
Microarray Analysis of the Control of cell division • Experimental set up • Constructed DNA microarrayscontaining 2966 predicted ORFs • Isolated swarmer cells which were allowed to proceed synchronouslythrough the 150-min cell cycle • RNA was harvested from samples taken at 15-min intervals • identifiedRNAs which varied in function of the cell cycle • Using an algorithm to identify expression profiles thatvaried in a cyclical manner • identified 553 cell cycle-regulated transcripts including the 72 genes with previously characterized cell cycle-regulatedpromoters Reprinted from: Laub et. Al., Science, 290, 5499 (2000)
Clustered Expression Profiles for the 553 Cell Cycle-regulated Transcripts • Temporallyregulated genes are • maximally expressed at specific times throughout the entire cell cycle • Genes were induced immediately before or coincidentwith each cell cycle-regulated event Reprinted from: Laub et. Al., Science, 290, 5499 (2000)
Profiles Profiles of Genes Associated With DNA Replication and Cell Division Reprinted from: Laub et. Al., Science, 290, 5499 (2000)
Expression Profiles of Genes Involved in Flagellar Biogenesis • Genes for flagellarbiogenesis are • organized in a 4-level transcriptional hierarchy • The expression of each class of genes is required forexpression of all subsequent classes • Pili and flagellarbiogenesis are apparently organized as a temporal transcriptionalcascades Reprinted from: Laub et. Al., Science, 290, 5499 (2000)
Conclusions • The global analysis of bacterial cell cycle regulation • has established the outline of thecomplex genetic circuitrythat controls bacterial cell cycle progression • identified 553 genes whosemRNA levels varied as a function of the cell cycle, demonstrating that • (i) genes involved ina given cell function are activated at the time of execution ofthat function • (ii) genes encoding proteins that function in complexesare coexpressed • (iii) temporal cascades of gene expressioncontrol in multiprotein structure biogenesis Reprinted from: Laub et. Al., Science, 290, 5499 (2000)
Gene expression profiling predicts clinical outcome of breast cancer • Paper presents • The application of gene expression profiling to diagnose breast cancer patients • that are likely to develop metastases and should receive chemotherapy • Exemplifies the clinical applications of microarray technology Van 'T Veer et. al., Nature 415, 530 (2002)
Experimental design • Microarray hybridizations • Oligonucleotide microarrays for 25.000 human genes • Selected 98 primary breast cancers from • 44 patients with good prognosis (disease-free for >5 years) • 34 patients with poor prognosis (developed metastases within 5 years) • 20 patients with BRCA1 and BRCA2 mutations • Hybridized RNA isolated from frozen tumor material • Data analysis • Two-dimensional unsupervised hierarchical clustering of • The 98 tumor samples • the 5000 genes that were significantly regulated Reprinted from: Van 'T Veer et. al., Nature 415, 530 (2002)
Cluster Analysis of 98 Breast Tumours Good prognosis Poor prognosis Reprinted from: Van 'T Veer et. al., Nature 415, 530 (2002)
Prognostic expression markers • Identification of predictive genes • 3-step supervised classification method selected • From 5000 significantly regulated genes 231 genes were selected as significantly associated with the disease outcome • The 231 genes were rank ordered on the correlation • an optimal set was selected iteratively that showed the strongest power to classify the tumors • Selected 70 genes that • correctly predict 85% of the patients • Can be used to diagnose patients for chemotherapy Reprinted from: Van 'T Veer et. al., Nature 415, 530 (2002)
Expression profiles of the 70 predictive genes sensitivity accuracy Reprinted from: Van 'T Veer et. al., Nature 415, 530 (2002)