Download
1 / 18
180 likes | 752 Views
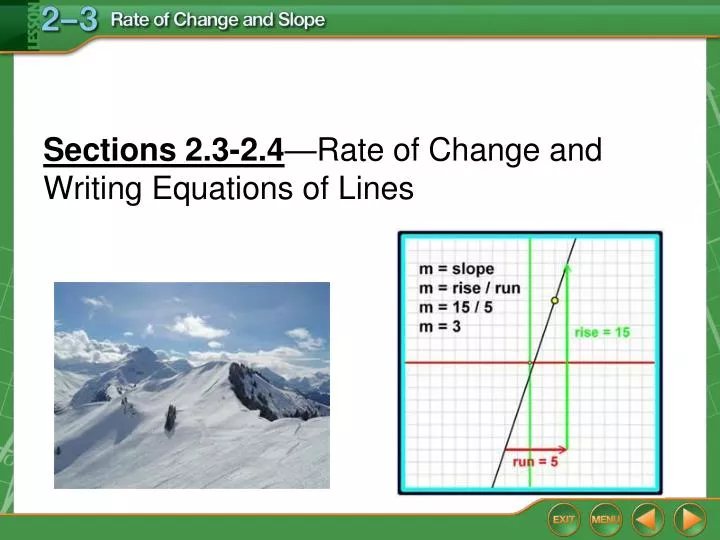
Sections 2.3-2.4 —Rate of Change and Writing Equations of Lines. Constant Rate of Change. COLLEGE ADMISSIONS In 2004, 56,878 students applied to UCLA. In 2006, 60,291 students applied. Find the rate of change in the number of students applying for admission from 2004 to 2006. Example 1.

E N D
Sections 2.3-2.4—Rate of Change and Writing Equations of Lines
Constant Rate of Change COLLEGE ADMISSIONS In 2004, 56,878 students applied to UCLA. In 2006, 60,291 students applied. Find the rate of change in the number of students applying for admission from 2004 to 2006. Example 1
Find the rate of change for the data in the table. A. 2 ft/min B.3 ft/min C.4 ft/min D.6 ft/min Write a Linear Equation to Model this data: Example 1
Average Rate of Change BUSINESSRefer to the graph below, which shows data on the fastest-growing restaurant chain in the U.S. during the time period of the graph. Find the rate of change of the number of stores from 2001 to 2006. Example 2
COMPUTERS Refer to the graph. Find the average rate of change of the percent of households with computers in the United States from 2000 to 2004. A. increase of 3.25 million per year B. increase of 6.5 million per year C. increase of 3.25% per year D. increase of 13% per year Example 2
Find Slope Using Coordinates Find the slope of the line that passes through (–1, 4) and (1, –2). Write an Equation of a Line through these two points Example 3
Find the slope of the line that passes through (9, –3) and (2, 7). Write an Equation of a Line through these two points Example 3
Find Slope Using a Graph Find the slope of the line shown at the right. Example 4
Write an Equation of a Perpendicular Line Write an equation in slope-intercept form for the line that passes through (3, –2) and is perpendicular to the line whose equation is y = –5x + 1. Example 4
Write an equation of a line that is parallel to the line y = -3x + 4 and that also goes through the point (2, 5).
1. The surface of Grand Lake is at an elevation of 648 feet. During the current drought, the water level is dropping at a rate of 3 inches per day. If this trend continues, write an equation that gives the elevation in feet of the surface of Grand Lake after x days.
2. Tim began a hike near Big Bear Lake, California at the base of the mountain that is 7000 feet above sea level. He is hiking at a steady rate of 5 more feet above sea level per minute. Let A be his altitude above sea level in feet and let t be the number of minutes he has been hiking. Write an equation in slope-intercept form that represents how many feet above sea level Tim has hiked
What is fastest interval for the function graphed below? When was the subject standing still?
Between which period of time did gas prices increase the most? Least? When did prices not move? Did it ever decrease?