Download
1 / 10
100 likes | 227 Views
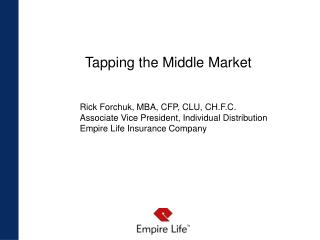
Tapping the Market Liquidity and Alternative Funding Structures. Presented by Norman Wilson, ABIF. Combined Bank Loan Trend. $3,000m. Local liquidity pressures leading to increase in foreign currency financing for a number of major transactions. $99m.

E N D
Tapping the Market Liquidity and Alternative Funding Structures Presented by Norman Wilson, ABIF
Combined Bank Loan Trend $3,000m Local liquidity pressures leading to increase in foreign currency financing for a number of major transactions $99m
Relationship between Domestic Liquidity and Reserves $1,359m -Recall of offshore investment • Improvement in Trade deficit • Increase in Foreign loan • IMF SDR Increase Inflow from bond issuance U$100m -GFC impact -Increase in oil price to U$150/barrel – liquidity drain • Fiji Govt floated U$150m bond • FNPF offshore investment flowing back in F$100m Devaluation Redemption of RBF Notes $75m 2 SRD increase totalling 3% $515 m FCY Loans $99m MNC Profits $100m $200m Bank Capital
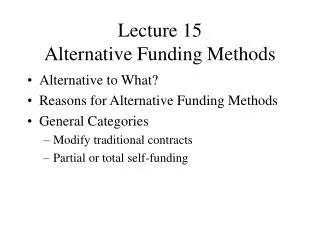
Financing sources • Equity • Self • Private equity (institutional investors) • Angel investors • Stock exchange (IPO)
Financing sources • Debt • Senior debt, i.e. banks. • Commercial paper/ Bonds • Mezzanine finance
Capital structure options • Raise own Capital, from savings and borrowing from family members. • Own equity + debt financing. • Own equity + Private equity + debt (bank) • Own equity + Mezzanine Finance + bank finance
1 Raise own Capital - 100% 100% equity, carrying 100% risk as well. Low Return on Equity because its all self funding. Pay back period is about 5yrs 2 Own equity + debt financing (40%+60%) Return on Equity is higher as equity is reduced Pay back period is 4.3yrs Assumptions:Initial Capital – FJ$8mBank debt – 9%Mezzanine Finance – 12%Private equity – 20% Sales cost – 60% (Gross Profit margin of 40%)Overhead – 25% (Net Profit margin of 15%)
3 4 Own equity + Private equity + debt (bank) 20% + 20% + 60% Return on Sales again lower than option 1, because of interest portion. ROE is higher as Investment is only 20% of total capital. Pay back period is about 5 yrs. Own equity + Mezzanine Finance + bank finance (20% + 20% + 60%) Return is sales is the lowest because of higher interest from Mezzanine Finance. Pay back period is about 4.6 yrs Assumptions:Initial Capital – FJ$8mBank debt – 9%Mezzanine finance – 12%Private equity – 20% Sales cost – 60% (Gross Profit margin of 40%)Overhead – 25% (Net Profit margin of 15%)