Download

1 / 29
290 likes | 682 Views
DIVERSITY. Christia Swan. TO COME. DIVERSITY RELATIONSHIP OF DIVERSITY & STABILITY DIVERSITY INDEX MICROCLIMATES USING QUADRANTS. DIVERSITY. DIVERSITY is all about how many different species there are in an ecosystem.

E N D
DIVERSITY Christia Swan
TO COME • DIVERSITY • RELATIONSHIP OF DIVERSITY & STABILITY • DIVERSITY INDEX • MICROCLIMATES • USING QUADRANTS
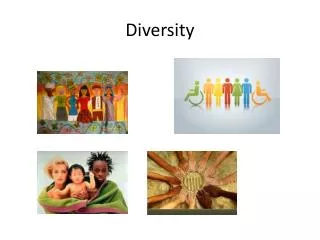
DIVERSITY • DIVERSITY is all about how many different species there are in an ecosystem. • Diversity is the number and variety of organisms found within a specified geographic region. • In total about 1.5 million species have been described • However, the total number of species on Earth may be as high as 10 million
DIVERSITY AND STABILITY • ECOSYSTEMS with a large diversity of species tend to be more stable than those that are less diverse • Stable ecosystem • Resistant to change • If disrupted, return to original state quickly • I.E. Climate extremes, pest and disease over a long period
LOW DIVERSITY • Predator species don’t have much choice of prey • Prey species is reduced or wiped out • Predator species will be at risk
MONOCULTURES • Agricultural areas where only one crop is grown • COTTON FIELDS • Artificially low diversities
EXTREME ENVIRONMENTS • TUNDRA, DESERTS, SALT MARSHES, AND ESTUARIES • Low diversities
AREAS OF LOW DIVERSITY • Plant and animal populations are mainly affected by abiotic factors • ABIOTIC FACTORS: • Nonliving components that effect the living organisms • For examples: • Radiation • Temperature • Water
HIGH DIVERISTY • Predator species will have a large selection of possible prey species • One of the prey species is wiped out • Still plenty of other species that predators can eat
MATURE, NATURAL ENVIRONMENTS • Old, oak woodlands • Environmental conditions aren’t too hostile • Affected by biotic factors • BIOTIC FACTORS: • Of or relating to life • For example: • Plants, animals, fungi, bacteria
DIVERSITY INDEX • How diversity is measured • Could just count up the number of species • This takes no account of the population size of each species • Species that are in an ecosystem in very small numbers shouldn’t be treated the same as those with bigger populations
DIVERSITY INDEX • AN equation for diversity that takes different population sizes into account. • To calculate the diversity index of an ecosystem • d = N(N-1) / ∑ n(n-1) • Where... • N= Total number of organisms of all species • n= Total number of one species • ∑= ‘Sum of’ (i.e. added together)
DIVERSITY INDEX • Higher the number the more diverse the area is • If all the individuals are of the same species (i.e. no diversity) the diversity index 1
MICROCLIMATES • Small areas where thee abiotic factor are different from the surrounding area. • The underneath of a rock • Different microclimate than the top surface • Cooler and more humid • Provides a slightly different habitat that will suit certain species • Variety of microclimates can support a high divesity
Let’s see if you get it 3 different species of flower 11 organisms altogether 3 red 5 yellow 3 purple Diversity index d=N(N-1) / ∑n(n-1) d=11(11-1) / 3(3-1) + 5(5-1) + 3(3-1) d=110/6+20+6 =3.44 When calculating the bottom half of the equation you need to work out the n(n-1) bit for each different species then add them all together.
MICROCLIMATES • BASICALLY • more microclimates = more species= higher diversity
FACTORS TO CONSIDER • ECOLOGISTS look at three key factors when they’re working out diversities • Species frequency • Species richness • Percentage cover
SPECIES FREQUENCY • HOW ABUNDANT A SPECIES IS IN AN AREA
SPECIES FREQUENCY • TOTAL NUMBER OF DIFFERENT SPECIES IN AN AREA
PERCENTAGE COVER • HOW MUCH OF THE SURFACE IS COVERED BY A PARTICULAR PLANT SPECIES • (NOT FOR ANIMALS THOUGH AS THEY MOVE AROUND TOO MUCH)
USING QUADRANTS • Measuring the three key factors use a piece of equipment called a frame quadrant • FRAME QUADRANT • A square frame made from metal or wood • The area inside the square is the quadrant
QUADRANT FRAMES • Laid on ground (or the river / sea/ pond bed if it’s an aquatic environment) • Total number of species in the quadrant is recorded • As well as the total number of individuals of each species
RANDOM SAMPLING • Not practical to collect data for a whole area • Takes ages • Can be costly • Samples are taken instead • Data samples are used to calculate the figures for the entire area being studied • Random sampling avoids bias
AGAIN...SPECIES FREQUENCY • Measured by counting how many quadrants each species in and is given as a percentage • If a species was found in 5 out of 20 quadrant samples • The frequency would be 25%
PERCENTAGE COVER • Measured by dividing the area inside the quadrant frame into a 10x10 grid and counting how many squares each species takes up • Sometimes plants overlap so the percentage cover ends up being more than 100%
OH AND...SPECIES RICHNESS • Measured by counting up the total number of species found in all the samples • Assume that the number of different species in your sample is the same as the number in the whole area that you are studying
QUESTIONS FOR YOU • What is meant by a ‘stable’ ecosystem? • Give three examples of ecosystems that are likely to be unstable? • What is the difference between the diversity index and species richness? • Why do percentage cover measurements sometimes add up to more that 100%?