Download
1 / 14
140 likes | 146 Views
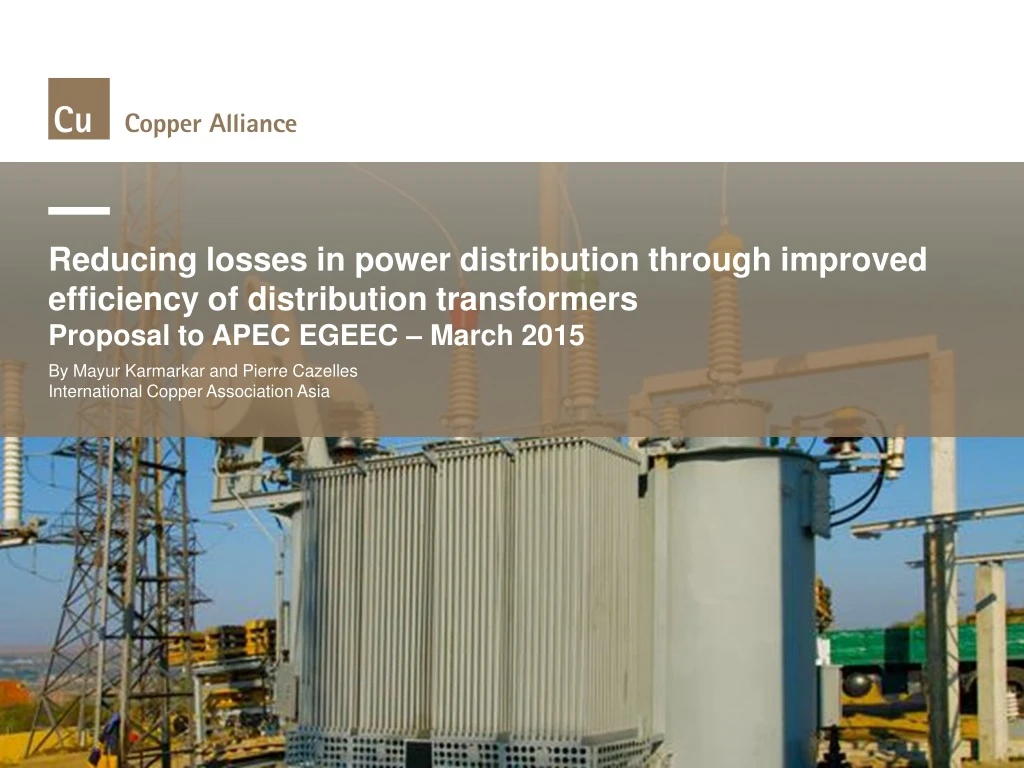
Reducing losses in power distribution through improved efficiency of distribution transformers Proposal to APEC EGEEC – March 2015. By Mayur Karmarkar and Pierre Cazelles International Copper Association Asia. Distribution losses.

E N D
Reducing losses in power distribution through improved efficiency of distribution transformersProposal to APEC EGEEC – March 2015 By Mayur Karmarkar and Pierre Cazelles International Copper Association Asia
Distribution losses Electrical equipment (for production, air conditioning, and illumination) Transmission and distribution (electric power companies) Low-Voltage Distribution (factories and buildings) Power plant Consumer side 100% 95% 95% 91% 5% 4% Loss Loss Based on IEA data, transmission and distribution (T&D) losses in electricity networks in APEC economies vary from a low of 2.8% to a high of 15.6 % of final consumption. About a third of T&D losses take place in distribution transformers (DTs).
DT losses in APEC economies From APEC EWG 15/2012A: APEC Distribution Transformers Survey: Estimate of Energy Savings Potential from Increase in MEPS: LBNL’s quantitative analysis shows that the cost-effective potential for distribution transformers in the APEC economies represents: • 32 terawatt hours (TWh) of electricity savings in 2030, roughly equivalent to the output of eleven 500-MW power plants. • 20 percent reduction over the 157 TWh electricity distribution losses projected in 2030 • 18 million tons (Mt) of annual carbon dioxide (CO2) emissions reductions by 2030, equivalent to 450,000 cars taken off the road. • 135 Mt of cumulative emissions savings between 2016 and 2030 • 19 billion USD in cumulative consumer financial benefits
MEPS and EESL • The potential energy savings estimated by LBNL could be achieved through pro-active MEPS and EESL programs. • The EE standards used have a determining impact on the energy saving potential of such programs • IEC upcoming standard on EE for DTs describes 3 scenarios: • Load losses / no load losses • Efficiency at 50% load • Peak efficiency index
Measurement of EE in DT Load factor Time
Measurement of EE in DT These losses are not measured with standards using 50% load method For practical reasons, many standards measure the energy efficiency of DT at 50% load (Ideal case), whereas actual losses in a DT are determined by: No Load Loss + (Load Loss X Load Factor2)
Impact of using 50% load to measure EE • (With reference to previous slide) Due to change in load curve shape & design options in DT losses: • ACTUAL energy consumption of DTs (and therefore losses) is HIGHER than the “best case” scenario (using the 50% load standard) by 24% (realistic case) to 73% (worst case) • The energy savings estimates of LBNL of 32 TWh (by 2030) in APEC economies should therefore be much higher by up to 23 TWh • This corresponds to an uncertainty about energy savings and actual energy consumption by 73% • In other words, using 50% load to test the EE of DTs: • does not allow to capture the actual losses of DTs • does not allow to correctly estimate energy savings potential • does not create avenues for appropriately and efficiently improve efficiency in DTs through technology drive
Rationale • The best way to estimate the ACTUAL energy consumption and energy efficiency of DTs is the load/no-load losses approach, as it best reflects the actual situation • EU and China have already adopted this method • Consultation with utilities: • Matches with existing procurement practices (procurement notices specify requirements in terms of load/no-load losses) • Higher flexibility of usage (irrespective of load curve) • Transformers are designed based on load/no-load losses (no impact on industry with adoption of load/no-load losses method, no impact on test protocol) • Advantage: • (much) better estimate of actual energy consumption of DTs and distribution losses • Push manufacturers to enhance design of DTs to increase EE at peak load conditions
Proposal objective • Long-term objective: APEC member economies reduce distribution losses through adoption of most appropriate method to regulate energy performance of DTs • Specific objectives: • Provide understanding of technology options and potential for further improvement of energy performance • Comparative analysis of efficiency @ 50% load vs. load/no-load losses and peak efficiency index to measure uncertainty in distribution loss estimates • Recommend most appropriate method; impact analysis
Proposed approach Performance (EE) of DTs depends on design/components as well as load curve Study technological trend while optimizing loss performance in distribution transformers and possible impact on each loss components • Study load curve changes due to liberalization of electricity markets, smart grids, energy storage, distributed generation etc. The most appropriate method to measure EE (50% load, load/no-load losses) should depend on realistic load curve profiles and technology options • Relate above two studies and suggest the method to regulate energy performance in DTs to minimize uncertainty in energy saving benefit (from 50% EE to load/no-load losses standard) • Dissemination through international conference • Prepare White Paper for policy makers • International consultation with utilities and manufacturers
Budget • Project duration: 2 years • Budget: • Consultant: 100K • Honorarium for Steering Committee members: 15K • Meetings of SC: 45K • International conferences (2): 100K • Total: 225K • APEC: 160K / ICA: 100K (for the international conferences)
Thank you • For more information, please contact: • Mayur Karmarkar, • mayur.karmarkar@copperalliance.asia • Pierre Cazelles, • Pierre.cazelles@copperalliance.asia