Download
1 / 45
450 likes | 568 Views
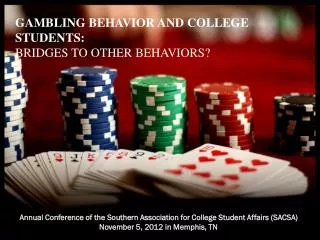
Taking A Survey of Gambling Attitudes and Behaviors from Paper to Practice. National Conference on Problem Gambling July 13, 2012. Mark Vander Linden, MSW Program Manager Iowa Department of Public Health Office of Problem Gambling Treatment and Prevention. Presentation Overview.

E N D
Taking A Survey of Gambling Attitudes and Behaviors from Paper to Practice National Conference on Problem Gambling July 13, 2012 Mark Vander Linden, MSW Program Manager Iowa Department of Public Health Office of Problem Gambling Treatment and Prevention
Presentation Overview • Describe the 2011 Iowa Gambling Attitudes and Experiences Survey, • Review findings in detail, • Discuss implications of findings as related to intervention and prevention efforts.
Background & Purpose • The Iowa 2011 Gambling Attitudes and Experiences Survey was conducted by the Center for Social and Behavioral Research (CSBR) at the University of Northern Iowa (UNI) and funded by the Office of Problem Gambling Treatment and Prevention at the Iowa Department of Public Health (IDPH). • The primary purpose of the survey was to collect data from adult Iowans about: • types and frequency of gambling activities, • prevalence of problem gambling, and • awareness and opinions of publicly-funded gambling treatment services. • Methodology • Address-based sampling (ABS) • Random sample of adults living in residential households in Iowa • Online questionnaire or telephone interview • Fielding period February 26 -- May 9, 2011 • 1,700 respondents (470 online and 1,230 by telephone) • Analysis and Exploration • Dr. Jeffrey Marrotta, Problem Gambling Solutions, Inc.
Topics • Gambling activities • Prevalence • Self-described frequency of gambling • Recency • Most regularly engaged • Favorite activity • Reasons for gambling & not gambling • Gambling Myths • Problem gambling • Attitudes about and awareness of treatment
Gambling Activities • Gambling activity list • Slot machines • Table games at a casino such as poker, roulette, craps, or blackjack • Video poker, video keno, or video blackjack • Dice games • Scratch tickets or pull-tabs • Lotteries such as Powerball, Hot Lotto, Mega Millions, and daily numbers • Racetracks (either horses or dogs) • Bingo • Card games with friends, family, or others but not at a casino • Games of personal skill such as pool, bowling, video games, or playing basketball • Fantasy sports leagues or games (include only if entry fee to play) • Office pools such as college basketball tournaments or “delivery dates” for babies • Other sports betting on professional, college, or amateur games or events • Raffle tickets (including those in support of charitable causes) • Online gambling using the Internet • Live keno • Video lottery machines • High-risk trading of stocks, commodities, and futures • Some other game, activity, or event not listed above
Prevalence Rates by Age Group Most Common Among 35 to 49 and 50 to 64 year olds
Self-Described Gambling Frequency “Thinking about all types of activities that involve wagering money or possessions, would you say you bet or gamble very often, often, occasionally, seldom, or never?”
Highest Gambling Activities At least once by 50% or more
Lowest Gambling Activities At least once by less than 20%
Gambling Activities (Regular Engagement) Infrequently= A few days per year or one day in past 12 months Monthly= Once or twice per month Daily or Weekly = One to three times per week or about every day.
Favorite Gambling Activities Adults Slot machines: 19% Lotteries (numbers): 12% Table games at casinos: 12% Cards (not at casinos): 10% Scratch tickets or pull tabs: 8% Men Table games at casinos : 18% Cards (not at casinos): 13% Lotteries (numbers): 12% Slot machines: 12% Fantasy sports: 5% Women Slot machines: 26% Scratch tickets or pull tabs: 13% Lotteries (numbers): 12% Cards (not at casinos): 8% Bingo: 5%
Reasons for Gambling(Among those who said they gamble occasionally, often, or very often) 49% 42% 40% 35% 28% 16% 12% 11% Note. The cumulative percentage on entertainment or fun appears to sum incorrectly due to the effects of rounding.
Gambling is dangerous for family life • Nearly two-thirds (64%) agreed that “Gambling is dangerous for family life,” • About one-half (51%) agreed that “Gambling is a harmful form of entertainment.”
Problem Gambling • Pathological Gambling (specific meaning) • Ever (Lifetime) and past 12 months • 10 DSM-IV based symptoms (NODS) • Probable pathological = 5 or more symptoms • Problem gambler/Possible pathological = 3 or 4 symptoms • At-risk = 1 or 2 symptoms • Problem Gambling (specific meaning) • Past 12 months • Problem Gambling Severity Index (PGSI) • 9 Symptoms (Never = 0 , sometimes = 1 , most of the time = 2, always = 3) • Problem gambling = 8 or more points • Moderate risk= 3 to 7 points • Low risk = 1 to 2 points • Self-defined gambling problem (ever and now) • Problem Gambling (general use) • Probable pathological or possible pathological/problem gambler (NODS), problem gambling (PGSI), or self-defined gambling problem • Any Problem Gambling Symptoms • With symptom(s) = 1 or more symptom from NODS, PGSI, or self-defined gambling problem • Without symptoms = zero symptoms on NODS, zero points PGSI, and not self-defined with gambling problem
Problem Gambling (PGSI) (Past 12 Months) • Most commonly experienced symptoms: • Felt guilty about the way you gambled or what happens when you gamble • Bet more than you could afford to lose
Problem Gambling (Self-Defined) • 2% of adult Iowans EVER thought they might have a problem with gambling • Less than 0.5% of adult Iowans think they NOW have a gambling problem
Combining Multiple Measures(Ever) • Men higher prevalence than women • No statistically significant differences by age group.
Combining Multiple Measures(Past 12 Months) • Men higher prevalence than women • No statistically significant differences by age group.
Very Important Reasons for Gambling All Gamblers Fun or entertainment: 24% Excitement or challenge: 14% Socializing: 13% Support a worthy cause: 7% Just to win money: 5% With Problem Gambling Symptom Fun or entertainment: 39% Excitement or challenge: 30% Socializing: 14% Support a worthy cause: 11% Just to win money: 8% Without Problem Gambling Symptoms Fun or entertainment: 18% Socializing: 13% Excitement or challenge: 7% Support a worthy cause: 4% Just to win money: 4%
Gambling Myths Agreement with common gambling myths by adult Iowans • 13% agree watching the pattern of wins and losses will help a person to win • 12% agree playing more than one slot machine improves a person’s odds of winning • 5% agree the more a person gambles, the better their odds of coming out ahead • 2% agree if a person keeps gambling, their luck will change and they’ll win back the money they lost • 2% agree that when a person almost wins, it is a good sign that they are due to win soon • 20% of adults 50-64 with gambling symptoms believed that playing more than one slot machine improves a person’s odds of winning vs 4% without gambling symptoms
“Lucky Techniques” • 6% of adults who gambled in past 12 months had a “lucky technique” • Have “lucky technique” by problem gambling symptom (past 12 months) • 4% Without symptoms • 14% With 1 or more symptoms (past 12 months) • 20% of women age 35-64 with symptoms believe they had a “lucky technique” compared to 4% without
Effect of Problem Gambling on Others More than 1 in 5 adult Iowans (22%) have been negatively affected by the gambling behaviors of family members, friends, or others they know. 15% Others 11% Friends/Coworkers 9% Family 1 in 3 (34%) who have ever experience any symptom of problem gambling said they had personally been negatively affected by someone else's gambling behavior About 1
Want to Reduce or Quit Gambling Percent of adult Iowans who had any problem gambling symptoms in the past 12 months who want to decrease or quit gambling. 18% Percent of adult Iowa gamblers who want to decrease or quit gambling. 8% 2% 5% 5% Decrease Time Decrease Time 7% 13% 10% Decrease Money Decrease Money Quit Altogether Quit Altogether
Accessing Treatment Services • 36% knew of treatment options in their community • 15% said there were no convenient treatment options
Identifying Problem Gambling More than two-thirds of Iowans are confident they would recognize the signs that a friend or family member has a gambling problem.
Treatment Effectiveness 94% admire the courage of people who seek help for a gambling problem
Importance of Public Funding for Treatment and Prevention 91% 85% 85% 76% Note. The cumulative percentage on educate young people appears to sum incorrectly due to the effects of rounding.
Discussing Problem Gambling Respondents who had ever experienced any symptoms of problem gambling or said they may have a gambling problem were asked how many people, if any, they had talked to about their gambling. • Nearly 1 in 4 of those (24%) who have experienced one or more problem gambling symptoms during the past 12 months said they have talked with someone about their gambling.
Gambling in the Home when Growing up • When asked to think back on their home life when they were growing up, about 3% of adult Iowans said that someone in their family had a serious problem with gambling when they were younger. • Growing up in a household where someone had a gambling problem was reported by 5% of those who experienced any gambling symptoms, regardless of whether these symptoms were experienced in the past 12 months or at any point in their lifetime.
Summary & Conclusions • Prevalence of Gambling • Lifetime: 88% in 1995 91% in 2011 • Past 12 months: 72% in 1995 69% in 2011 • Pathological or problem gambling • Low prevalence problem gambling (2% lifetime, 0.7% past 12 months) • Pathological (0.6% lifetime, 0.3% past 12 months) • Similar to previous 1995 Iowa estimate (1.9% lifetime, 1.0% current) • SOGS tend to estimate higher • Overlapping confidence intervals • Conclusion: Problem gambling rate appears unchanged since 1995 • Similar to national surveys • 0.4% Lifetime pathological (National Epidemiological Survey on Alcohol and Related Conditions; Petry, Stinson, & Grant, 2005) • Pathological of 0.6% lifetime & 0.3% Past 12 months (US National Comorbidity Survey Replication (NCS-R; Kessler et al., 2008)
Summary & Conclusions (continued) • Problem gambling symptoms and effects • 13% had 1+ problem gambling symptoms in the past 12 months • 18% of those with symptoms want to reduce or quit gambling • 22% said they were negatively affected by another’s gambling behaviors • Treatment and prevention • Two-thirds are confident they could recognize the signs of problem gambling • 90% are aware of 1-800-BETS-OFF helpline • Three-fourths or more support public funding for the four treatment and prevention activities
Implications For Problem Gambling Prevention: Summary & Conclusions • Provide social norms education to help prevent problem gambling. • Most people (81%) report that they never or seldom gamble • Only 2% of adults gamble on the internet (past 12 months) • Less than 2% of people borrow money to gamble, are ever told they have a gambling problem, or experience financial problems related to their gambling • More consumer education is needed to dispel gambling myths • Empower those who want to change their gambling behavior • Normalize and demystify treatment • Provide responsible gambling information • Inform the public about change tools (work books, smart phone aps, etc.)
Implications For Problem Gambling Prevention: Summary & Conclusions • Family Focus • For each problem gambler, 10 others are negatively affected • Nearly two-thirds (64%) agreed that “Gambling is dangerous for family life” • Encourage parents to discuss gambling with their children • Encourage people to speak to loved ones for whom they have gambling related concerns • When conducting treatment outreach efforts • Identify problem gambling symptoms • Provide hopeful messages • Target high risk populations with treatment outreach efforts • Hx of alcohol problems or tobacco use • Frequent slot players • Those with small social networks • Others . .
Final Thought:If you are a problem gambling clinician or prevention specialist, keep in mind that: The vast majority of the public supports your work . . . Your efforts are making a difference!
Gambling Attitudes and Behaviors: A 2011 Survey of Adult Iowans Full Report: http://www.idph.state.ia.us/IGTP/common/pdf/reports/attitudes_behaviors.pdf or email: Mark Vander Linden mark.vanderlinden@idph.iowa.gov