Download
1 / 1
10 likes | 117 Views
Modeling Plant Stability in a Networked Control System. Jue Wang – Arizona State University. S. Amin , B. Nelson, S. Schmeelk ; Prof.Shankar Sastry – TRUST UC-Berkeley. Conclusions and Future Work

E N D
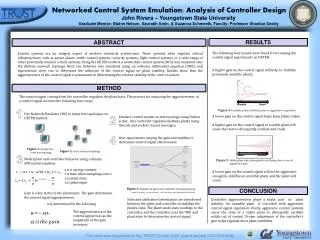
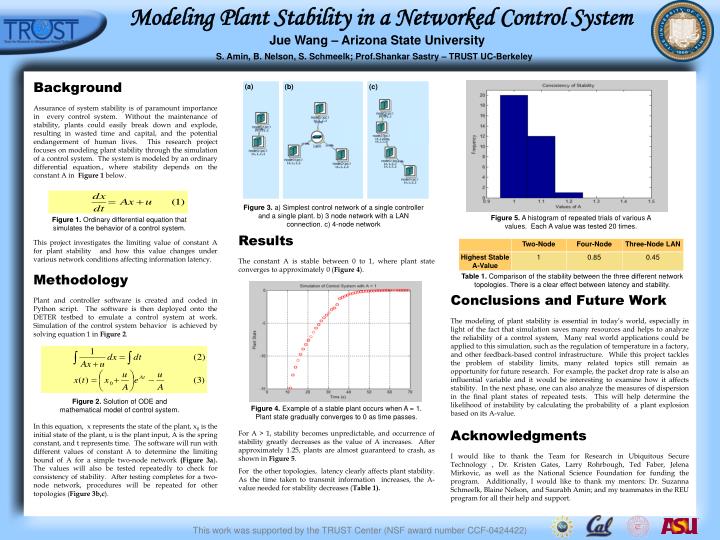
Modeling Plant Stability in a Networked Control System Jue Wang – Arizona State University S. Amin, B. Nelson, S. Schmeelk; Prof.ShankarSastry – TRUST UC-Berkeley • Conclusions and Future Work • The modeling of plant stability is essential in today’s world, especially in light of the fact that simulation saves many resources and helps to analyze the reliability of a control system, Many real world applications could be applied to this simulation, such as the regulation of temperature in a factory, and other feedback-based control infrastructure. While this project tackles the problem of stability limits, many related topics still remain as opportunity for future research. For example, the packet drop rate is also an influential variable and it would be interesting to examine how it affects stability. In the next phase, one can also analyze the measures of dispersion in the final plant states of repeated tests. This will help determine the likelihood of instability by calculating the probability of a plant explosion based on its A-value. • Acknowledgments • I would like to thank the Team for Research in Ubiquitous Secure Technology , Dr. Kristen Gates, Larry Rohrbough, Ted Faber, JelenaMirkovic, as well as the National Science Foundation for funding the program. Additionally, I would like to thank my mentors: Dr. Suzanna Schmeelk, Blaine Nelson, and SaurabhAmin; and my teammates in the REU program for all their help and support. • Background • Assurance of system stability is of paramount importance in every control system. Without the maintenance of stability, plants could easily break down and explode, resulting in wasted time and capital, and the potential endangerment of human lives. This research project focuses on modeling plant stability through the simulation of a control system. The system is modeled by an ordinary differential equation., where stability depends on the constant A in Figure 1 below. • This project investigates the limiting value of constant A for plant stability and how this value changes under various network conditions affecting information latency. • Methodology • Plant and controller software is created and coded in Python script. The software is then deployed onto the DETER testbed to emulate a control system at work. Simulation of the control system behavior is achieved by solving equation 1 in Figure 2. • In this equation, x represents the state of the plant, x0 is the initial state of the plant, u is the plant input, A is the spring constant, and t represents time. The software will run with different values of constant A to determine the limiting bound of A for a simple two-node network (Figure 3a). The values will also be tested repeatedly to check for consistency of stability. After testing completes for a two-node network, procedures will be repeated for other topologies (Figure 3b,c). • Results • The constant A is stable between 0 to 1, where plant state converges to approximately 0 (Figure 4). • For A > 1, stability becomes unpredictable, and occurrence of stability greatly decreases as the value of A increases. After approximately 1.25, plants are almost guaranteed to crash, as shown in Figure 5. • For the other topologies, latency clearly affects plant stability. As the time taken to transmit information increases, the A-value needed for stability decreases (Table 1). (a) (c) (b) Figure 3. a) Simplest control network of a single controller and a single plant. b) 3 node network with a LAN connection. c) 4-node network Figure 5. A histogram of repeated trials of various A values. Each A value was tested 20 times. Figure 1. Ordinary differential equation that simulates the behavior of a control system. Table 1. Comparison of the stability between the three different network topologies. There is a clear effect between latency and stability. Figure 2. Solution of ODE and mathematical model of control system. Figure 4. Example of a stable plant occurs when A = 1. Plant state gradually converges to 0 as time passes.