Download
1 / 10
100 likes | 236 Views
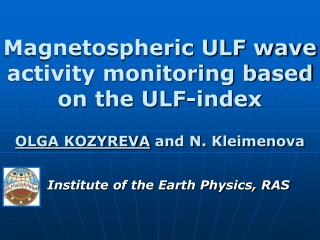
PLASMON WP2 Report on SANSA Activities (Southern African ULF Stations) Peter Sutcliffe SANSA Space Science. INTERMAGNET and ULF stations in Southern Africa. Namibia. South Africa. Example of FLR frequency determination. SUT. HER.

E N D
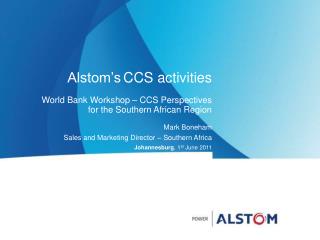
PLASMON WP2 Report on SANSA Activities (Southern African ULF Stations) Peter Sutcliffe SANSA Space Science
INTERMAGNET and ULF stations in Southern Africa Namibia South Africa
Example of FLR frequency determination SUT HER Example of Pc3 FLR frequency determination using amplitude difference and phase difference methods from SUT and HER induction magnetometer data.
INTERMAGNET and ULF stations in Southern Africa Namibia South Africa
Comparison of Hermanus Induction and LEMI-025 Magnetometers (Pc3) Induction LEMI-025
Comparison of Hermanus Induction and LEMI-025 Magnetometers (Pc4 & Pi2) Pc3-4 Induction Pi2 Pc3-4 Pi2 LEMI-025
INTERMAGNET and ULF stations in Southern Africa Namibia South Africa
Effect of O+ on FLR frequency Hattingh, S. K. F. and P. R. Sutcliffe, Pc3 pulsation eigenperiod determination at low latitudes, J. Geophys. Res., 92, 12433, 1987. Fig. 3. The mean and standard deviation of the dominant pulsation periods of the H-component observed at the stations SAA (L=1.84), AUG (L=1.64), MAR (L=1.52) and TSU (L=1.37) are indicated by the circles and error bars, respectively. The short dashed line shows the periods computed using a plasma model containing both O+ and H+ as a function of L-value. The long dashed line shows the periods computed with the same H+ distribution, but with O+ excluded.