Download
1 / 13
150 likes | 525 Views
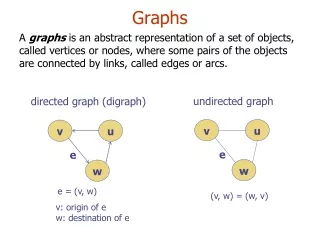
Graphs. Greg C Elvers, Ph.D. What Are Graphs?. Graphs are a non-textual means of presenting information Graphs quickly summarize large sets of data easily show trends in the data easily show the relation between two or more variables

E N D
Graphs Greg C Elvers, Ph.D.
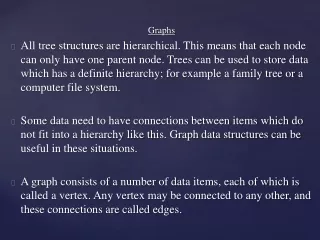
What Are Graphs? • Graphs are a non-textual means of presenting information • Graphs • quickly summarize large sets of data • easily show trends in the data • easily show the relation between two or more variables • The type of graph you use depends on what you want to show and the level of measurement
Selecting a Graph Type For what do you want to use your graph? See Relations Summarize See Trends
Summarizing Data • There are several graphs that are designed for summarizing data: • Bar charts • Histograms • Tukey box plots
Bar Charts • Bar charts show the number of items in each of several categories • The X axis (or abscissa) contains the categories • The Y axis (or ordinate) contains the frequency • Most often used with nominally scaled data
Histograms • Histograms are similar to bar charts, except they are used with at least ordinally scaled data • The bars are adjacent to each other to emphasize the continuous nature of the scale
Tukey box plots compactly displaymany descriptive statistics: * • Mean • Median • Interquartile range • Range • Outliers Tukey Box Plots
Seeing Trends in Data • A trend is a relation between two or more levels of an independent variable • E.g., as time spent studying increases, exam scores tend to increase • Many of the graphs used to display summary information can also be used to display trends in the data • The line graph is especially useful
Line Graphs • A line graph plots the independent variable on the abscissa and the dependent variable on the ordinate • It assumes that the data are continuous in nature
Seeing Relations in Data • Often you will want to see if two variables are related to each other • E.g., is amount of alcohol consumed per week related to college GPA? • Scatter plots are often used to display this type of relation
Scatter Plots • A scatter plot is a graph with one variable on the ordinate and the other variable on the abscissa • Each observation is then plotted at its appropriate X and Y coordinates
Guidelines for Creating Good Graphs • Think carefully about what you want to show, and use the graph that shows it the best • Keep the graph uncluttered • No graph title • Keep legend out of the graph area • Avoid chartjunk (3D effects, shading, grid lines, hashing, etc.)
Guidelines for Creating Good Graphs • Make the axis labels sufficiently large; 24 points is a minimum • Choose the scale of the axes carefully; do not make the range of the scale artificially high (can hide effects) or low (can exaggerate effects) • There should be approximately 5 to 9 axis tick marks and labels per axis • Do not break the Y axis