Download
1 / 24
240 likes | 341 Views
Considerations when applying Paramics to Strategic Traffic Models Paramics User Group Meeting October 9 th , 2009 Presented Matthew Juckes. Who We Are Scotland, New Jersey, California offices Consultancy Project Audits/Peer Review / Training

E N D
Considerations when applying Paramics to Strategic Traffic Models Paramics User Group Meeting October 9th, 2009 Presented Matthew Juckes
Who We Are • Scotland, New Jersey, California offices • Consultancy • Project Audits/Peer Review / • Training • Paramics Training given to Caltrans, NYSDOT, NYCDOT, WISDOT and many others • British Chamber of Commerce - International Business Award 2009
Introduction • Strategic Model Example – I-405 District 12 • Study Area • Network Information • OD Matrix Information • Considerations • Project Scope • OD Development • Simulation Speed • Software Enhancements • Actuated Signals • Freeway MOE • Ramp Metering • HOV Lanes; and • HOT Lanes • Output Statistics • Conclusions
Study Area A 25.4 -mile segment of the I-405) from the Los Angeles/Orange County Line to the I-405/ I-5 Interchange. I-405 traverses an area with several key traffic generators and has freeway to freeway interchanges with the SR-73, SR55, SR-133 and I-5
I-405 Base Model Information • I-405 – Los Angeles/Orange County Line and I-405/ I-5 Interchange • 25.4 Miles • AM Period 06:00 – 10:00 (1 hour warm up period) • PM Period 15:00 - 19:00 (1 hour warm up period) • 3896 Links • 114 Zones • 49 Ramp Meters (SATMS) • 7 Freeway to Freeway Interchanges (I-605, SR-22 (two times) , SR-73, SR-55, SR-133 and I-5 ) • Gradients and grade separations Modelled
Matrix Totals I-405 AM Trip Matrix – 568,527 vehicles I-405 PM Trip Matrix – 639,594 vehicles
Matrix Development • Trip matrices have been developed for all vehicle types. These have been entered in 2 matrix levels corresponding to the Single Occupancy Vehicles (SOV) and the High Occupancy Vehicles (HOV). • A three-stage process has been used to develop the AM and PM peak hour trip matrices for both the SR-22 and I-405 models; • The original strategic model (OCTAM Model) was cordoned to produce an AM and PM demand matrices. • Infill for unobserved trips. Generations were estimated from each zone and distributed to other internal zones; these infill trips were predominantly applied to match the internal turning movements. • The matrices produced at the end of the above steps were then used as the input (pattern) matrices for the Paramics matrix estimation procedure. In essence this ME procedure uses link and turn counts to control changes to the matrix totals and trip distribution.
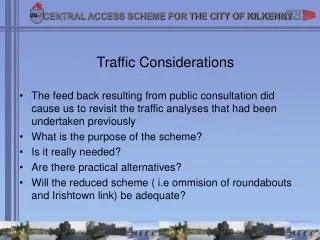
Project Scope • What is the aim of the project? Is it to consider mainline operation, arterial operation or both? • Is traffic data comprehensive? Is it comprehensive enough to achieve the aims of the project? • What are the key routes and intersections? • What is the model time period? • timescales/deadline – is it possible to deliver the project in the timescales? Large strategic models can be challenging to calibrate. • Are the software functionalities suitable/relevant to the project?
Simulation Speed • Default Time Steps - 2 Steps per Second • Increasing time steps will increase mean headway; and • Increases simulation time (and therefore project costs) • Think how many times model is run during Calibration • 300-400 times, 300X30 (min) = 9000min/60 = 150 hours / 8 = 19 days = roughly an extra month of work
Software Enhancements • Traffic Signals – Actuated/Fixed • Ramp Metering – Fixed/SATMS/TOS/Alinea • HOV Lanes – weaving/non weaving; and • HOT Lanes • What are the potential disbenefits using external software enhancements? • Reduced simulation speed • Model instability; and • Model complexity.
Fixed Time vs Actuated Signals • Fixed Time • Plus – Standard GUI, easy to create; • Minus – Does not always match real world conditions; • Actuated Signals • Plus – Better match of real world conditions - Greater signal capacity • Minus – Requires using VA script or API • Can be very time consuming and the final result is almost never perfect
Ramp Metering – Fixed/SATMS/TOS/Alinea • Fixed – Not a perfect situation but quick and easy; • Actuated simple – Simple call detection; • SATMS – Semi Actuated Traffic Metering System • Requires API • demand-capacity based traffic responsive control or Fixed time • TOS – I-880 – CALTRANS • Requires API • Alinea - local feedback ramp-metering strategy • Requires API • Some concern on the use of Downstream Volumes
HOV Lanes – weaving/non weaving • Separated links vs Restrictions with rules/API • Depends on goals of the projects and scenarios • HOT Lanes • Newly available function within paramics • Variable Cost Lanes • Dynamic link rules
What are the potential impacts to using external software enhancements? • Reduced simulation speed; • Model instability; • Model complexity; • Model technical support; • Multiple layering effect • Miss use of Plugin • Over use of Plugins
Output Statistics • Modelled Link Counts • Example: I-405 AM Northbound • Modelled Turning Counts • Example: I-405 AM • Travel Times • Individual vehicle travel times, mean, max and minimum • Is a comparison between modelled and surveyed travel times possible? • Speedplots – data output, what is being compared. • Visuals • Example
Macro – Micro Iterations In a perfect world no manual adjustment needed Regional Model (Macro) Sub-Area Macro Model Trip Table Micro-Model Re-Run Macro with Micro MOEs as new input Manual Adjustments Final Model Link and Node MOEs
Link Count Example 131 Turn Counts in I-405 Model >85% GEH < 5.0 for each hour
Turn Count Example 149 Turn Counts in I-405 Model >85% GEH < 5.0 for each hour
Travel Times • Individual vehicle travel times, mean, max and minimum • Is a comparison between modelled and surveyed travel times possible?
Visuals • Screenshots • 3D PMX models • When is it worth developing a detail 3D background for your model? • Google Sketchup – User friendly free PMX designer • Videos – I-880 Example
FHWA Guidelines • Bottlenecks • Counts • Travel Times • Does the order that these are validated in really matter? • Sometimes something has to give…
For Further Information Richard Braidwood richard@braidwoodassoc.com (213) 784 0889 or Matthew Juckes (732) 587 5786 matt@braidwoodassoc.com www.braidwoodassoc.com