Download
1 / 1
10 likes | 118 Views
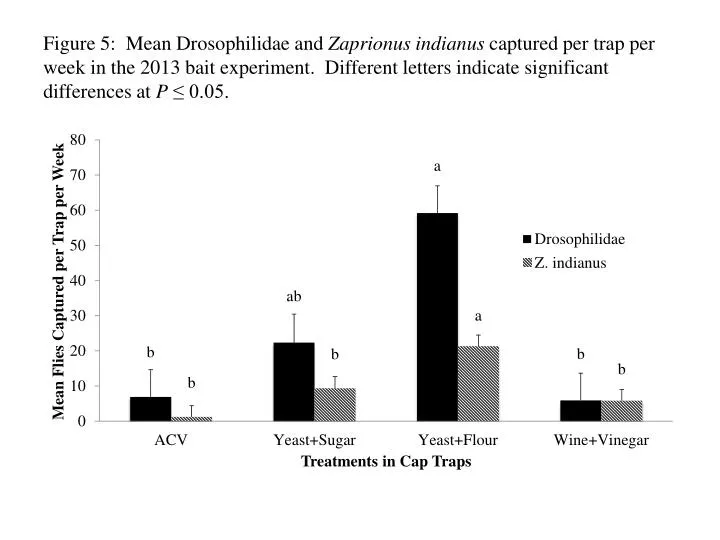
Figure 5: Mean Drosophilidae and Zaprionus indianus captured per trap per week in the 2013 bait experiment. Different letters indicate significant differences at P ≤ 0.05.

E N D
Figure 5: Mean Drosophilidae and Zaprionusindianus captured per trap per week in the 2013 bait experiment. Different letters indicate significant differences at P ≤ 0.05.