Download
1 / 81
820 likes | 1.05k Views
Same Speaker, Different Data? . Loudspeaker design and analysis tools. Presented at ALMA Asia Symposium 2010. Introductions. Prism Sound: Established 1987 (23 years) Founders Ian Dennis and Graham Boswell designed world’s first digital audio console at AMS Neve

E N D
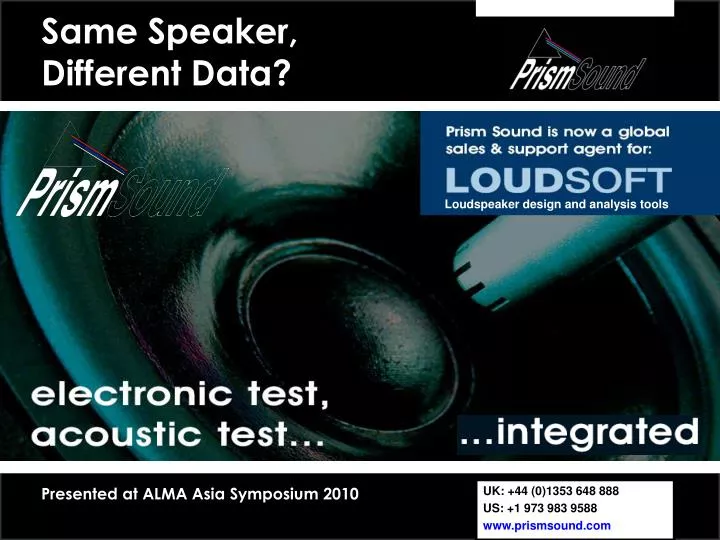
Same Speaker, Different Data? Loudspeaker design and analysis tools Presented at ALMA Asia Symposium 2010
Introductions • Prism Sound: • Established 1987 (23 years) • Founders Ian Dennis and Graham Boswell designed world’s first digital audio console at AMS Neve • Ian Dennis co-wrote AES-ABU digital interface standard • Professional audio logging / recording / editing solutions • Audio test and measurement equipment • Simon Woollard: • BSc (Hons) Audio Technology, University of Salford, UK • Worked as loudspeaker design engineer (NXT, Mission) • Now Applications Engineer for Prism Sound’s Test and Measurement Division Simon Woollard Prism Sound
Agenda • Introduction • Typical Measurement Setup • Discussion: Sources of Inconsistency • Recap • Conclusion
Part 1 • Introduction • Typical Measurement Setup • Discussion: Sources of Inconsistency • Recap • Conclusion
Introduction: Measurement Inconsistency • THE PROBLEM - Same Loudspeaker: • Different data!
Introduction: Measurement Inconsistency • We ship samples & employees across continents to investigate
Introduction: Measurement Inconsistency • We ship samples & employees across continents to investigate + • Measurement inconsistency costs time & money!
Part 2 • Introduction • Typical Measurement Setup • Discussion: Sources of Inconsistency • Recap • Conclusion
Typical Measurement Setup • Typical Loudspeaker Measurements: • On-axis frequency response • Off-axis frequency response (polar plot) • Power response • Distortion / non-linearities • Impedance • Thiele-Small parameters • Today we will discuss on-axis frequency response; Perhaps the most common loudspeaker measurement
Typical Measurement Setup • Typical Loudspeaker Measurements: • On-axis frequency response • Off-axis frequency response (polar plot) • Power response • Distortion / non-linearities • Impedance response • Thiele-Small parameters • Today we will discuss on-axis frequency response; Perhaps the most common loudspeaker measurement
Typical Measurement Setup • Typical frequency response measurement setup:
Typical Measurement Setup • Typical frequency response measurement setup: • Test System 1
Typical Measurement Setup • Typical frequency response measurement setup: • Test System • Amplifier 2 1
Typical Measurement Setup • Typical frequency response measurement setup: • Test System • Amplifier • EUT 2 1 3
Typical Measurement Setup • Typical frequency response measurement setup: • Test System • Amplifier • EUT • Baffle 2 1 4 3
Typical Measurement Setup • Typical frequency response measurement setup: • Test System • Amplifier • EUT • Baffle • Microphone 2 1 4 5 3
Typical Measurement Setup • Typical frequency response measurement setup: • Test System • Amplifier • EUT • Baffle • Microphone • Room / Chamber 2 1 4 5 3 6
Typical Measurement Setup • Typical frequency response measurement setup: • Test System • Amplifier • EUT • Baffle • Microphone • Room / Chamber POTENTIAL SOURCES OF MEASUREMENT INCONSISTENCY 2 1 4 5 3 6
Part 3 • Introduction • Typical Measurement Setup • Discussion: Sources of Inconsistency • Recap • Conclusion
Sources of Inconsistency:Test and Measurement System • Test System • Amplifier • EUT • Baffle • Microphone • Room / Chamber 2 1 4 5 3 6
Sources of Inconsistency:Test and Measurement System • Calibration of test system (2 main types): 1) Dedicated Hardware: • Usually calibrated by manufacturer • Typical accuracy ±0.05dB (absolute), ±0.05dB flatness • Should include amplitude ranging to ensure maximum noise / distortion performance at low signal amplitude 2) Generic Soundcard: • Requires calibration by operator, or errors could be ~dBs! • Noise and distortion of soundcard may affect accuracy at low amplitude (frequency response affected less)
Test and Measurement SystemFor Today’s Examples dScope Software dScope Series III Hardware USB IEC Baffle Cyrus III G.R.A.S. 46AE / 26CA
Sources of Inconsistency:Test and Measurement System • Possible stimuli for frequency response measurement: Stepped sine (sweep) Broad band noise Maximum length sequence (MLS) Continuous sweep (chirp) Multi-tone
Sources of Inconsistency:Test and Measurement System • Impulse response (using broad band stimulus) is widely used:
Sources of Inconsistency:Test and Measurement System • Impulse response (using broad band stimulus) is widely used:
Sources of Inconsistency:Test and Measurement System • Impulse response (using broad band stimulus) is widely used:
Sources of Inconsistency:Test and Measurement System • Impulse response methods require a broad band stimulus • Stepped sine sweep cannot remove room reflections Stepped sine sweep Log swept sine + Impulse response
Sources of Inconsistency:Test and Measurement System • Choice of window function affects frequency response: Window Function: Prism 7 Prism 5 Gaussian Blackman-Harris Hamming Hann Blackman Triangular Rectangular
Sources of Inconsistency:Test and Measurement System • Choice of window function affects frequency response: Window Function: Prism 7 Prism 5 Gaussian Blackman-Harris Hamming Hann Blackman Triangular Rectangular
Sources of Inconsistency:Test and Measurement System • Length of window function affects LF cut-off: t
Sources of Inconsistency:Test and Measurement System • Length of window function affects LF cut-off: • HF also affected by reflections in non-anechoic measurements Window Length: t = 5ms t = 10ms t = 15ms t = 20ms t = 25ms t = 30ms Shorter window
Sources of Inconsistency:Test and Measurement System • Low frequency cut-off is given by: f = 1 / t f = lowest valid frequency in measurement (Hz) t = length of time domain window (seconds)
Sources of Inconsistency:Test and Measurement System • Stimulus Amplitude: • Voice coil driving force is non-linear WRT transducer excursion • At high excursion, efficiency will be lower (e.g. low frequency) Excursion @2V, mm 6.0 4.5 3.0 1.5 0.0
Sources of Inconsistency:Test and Measurement System • At high excursion, efficiency will be lower (e.g. low frequency): Stimulus Amplitude: 15V 7.5V 3.75V 500mV 250mV 100mV 50mV
Sources of Inconsistency:Test and Measurement System • Start position of window can affect low frequency response: Correct Window Position
Sources of Inconsistency:Test and Measurement System • Start position of window can affect low frequency response: • LF attenuation due to early start of window function Correct Window Position Window Starts too early
Sources of Inconsistency:Power Amplifier • Test System • Amplifier • EUT • Baffle • Microphone • Room / Chamber 2 1 4 5 3 6
Sources of Inconsistency:Power Amplifier • Output / cable impedance: • Output impedance and cable impedance should be minimised, and ideally calibrated in the test and measurement system
Sources of Inconsistency:Power Amplifier • Assume a loudspeaker impedance as follows: • Assume amplifier output impedance + cable impedance is 0.5Ω; • We see error if we measure without calibration Loudspeaker impedance Frequency Response Measurement Error
Sources of Inconsistency:Baffle • Test System • Amplifier • EUT • Baffle • Microphone • Room / Chamber 2 1 4 5 3 6
Why do We need a Baffle? + + - - Positive voltage > outward cone motion Air compresses in front of diaphragm (positive pressure) Air expands behind diaphragm (negative pressure) Acoustic ‘short circuit’ at low frequency No significant acoustic radiation Using a baffle restores air pressure in front of diaphragm
Sources of Inconsistency:Baffle • If the wavelength is long compared to the baffle dimensions, radiation is omnidirectional (4π) • If the wavelength is short compared to the baffle dimensions, radiation is in the forward direction only (2π) : SPL is 6dB greater High Frequency Low Frequency
Sources of Inconsistency:Baffle • IEC / AES standards for baffle size; varies with transducer size IEC / AES standard baffle dimensions for transducers up to 8” diameter
Sources of Inconsistency:Baffle • Baffle should be large compared to wavelengths of interest • If baffle is too small, we see low SPL at low frequencies: Baffle Size: 1650 x 1450mm (IEC) 650 x 550mm
Sources of Inconsistency:Baffle • Ensure a good air seal between transducer and baffle • If air seal is poor, we see errors at low / mid frequencies: Air Seal: Airtight Poor Seal
Sources of Inconsistency:Microphone • Test System • Amplifier • EUT • Baffle • Microphone • Room / Chamber 2 1 4 5 3 6
Sources of Inconsistency:Microphone • Use a dedicated test and measurement microphone • Calibrate the microphone using manufacturer’s data Calibration data for G.R.A.S. 46AF mic S/N 57302
Sources of Inconsistency:Microphone • For highest precision, use a pistonphone or calibrator G.R.A.S. calibrator type 42AB G.R.A.S. pistonphone type 42AA
Sources of Inconsistency:Microphone • Correct for actual atmospheric pressure
Sources of Inconsistency:Microphone • Use the correct microphone capsule! Typically a choice of 2: Pressure microphone: For Measuring SPL at a boundary Mic does not modify pressure field Free-field microphone: For measuring SPL in free space Mic modifies pressure field, so is acoustically equalised to correct error