Download
1 / 14
140 likes | 237 Views
The formation of the plasmapause: Dynamical simulations. V. Pierrard Belgian Institute for Space Aeronomy J. Lemaire (Plasmapause mechanism) J. Cabrera (IMAGE observations) F. Darrouzet (CLUSTER observations).

E N D
The formation of the plasmapause: Dynamical simulations V. Pierrard Belgian Institute for Space Aeronomy J. Lemaire (Plasmapause mechanism) J. Cabrera (IMAGE observations) F. Darrouzet (CLUSTER observations)
Mechanism of plasma instabilityKp increases E increases in the morning sectorThe convection velocity increasesErosion of the plasmasphere in the post-midnight sector Formation of a plume Lemaire and Gringauz, The Earth’s plasmasphere, Cambridge University Press, 1998.
Input: KpE5D equatorial electric field (McIlwain, 1986)Empirical model determined from observations of ATS5 and ATS6
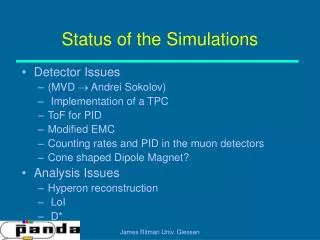
Dynamical simulationsPierrard and Lemaire, Geophys. Res. Lett., 31, 5, 2004. 9 June 2001 8h00
9 June 2001 16h00 23h00
May 2, 2001, 18h00 VERY QUIET June 26, 2000, 16h00 SUBSTORM June 25, 2000, 21h00 BETWEEN SUBSTORMS May 24, 2000, 9h00 STORM
Kp – L relation • * Numerical simulations for constant Kp • - Linear relation from Carpenter and Anderson [1992] • + EUV/IMAGE Kp decrease • + EUV/IMAGE • Kp increase
08:32 UT 20:10 MLT 7.7-8.1 RE 08:30 UT 20:10 MLT 24 18 06 12 CLUSTER07 May 2002 MLT=20:00, Kpmax=3, small separation distance (~150km) Plume observed in the inbound pass at the same time WHISPER: Waves of High frequency and Sounder for Probing of Electron density by Relaxation
07 May 2002: Simulation, EUV and CLUSTER Equatorial projection of EUV image at 08:31 UT: Plume close to the same MLT sector (23-24)
Conclusions • Simulations based on the instability mechanism • Use the Kp dependent electric field model E5D • Shoulders and plumes are associated to particular Kp evolutions. • The position of the plasmapause depends on Kp and its evolution with time. • Comparisons with IMAGE give similar structures in the same LT sector.