Download
1 / 20
200 likes | 348 Views
Traffic Restrictions Associated with the Sino-African Summit: Reductions of NO x Detected from Space. Forbidden City. Downtown Traffic 6pm. Yuxuan Wang, Michael B. McElroy, K. Folkert Boersma School of Engineering and Applied Sciences, Harvard University Henk J. Eskes, J. Pepijn Veefkind

E N D
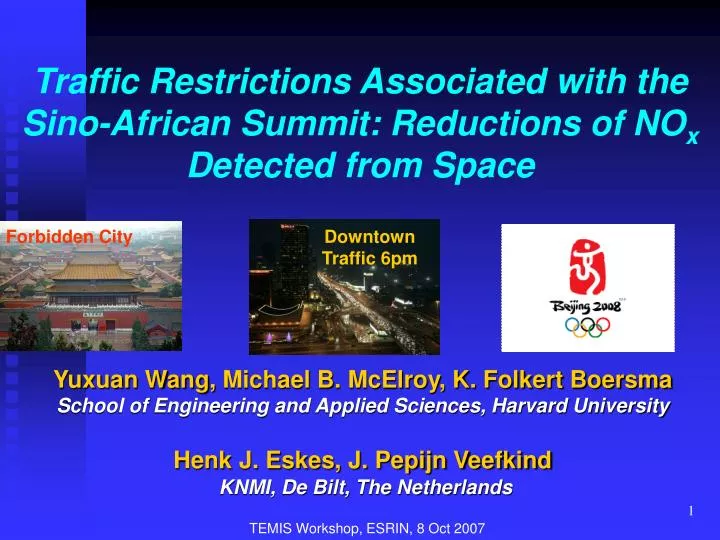
Traffic Restrictions Associated with the Sino-African Summit: Reductions of NOx Detected from Space Forbidden City Downtown Traffic 6pm Yuxuan Wang, Michael B. McElroy, K. Folkert Boersma School of Engineering and Applied Sciences, Harvard University Henk J. Eskes, J. Pepijn Veefkind KNMI, De Bilt, The Netherlands TEMIS Workshop, ESRIN, 8 Oct 2007
Secular Trends of NO2 over China (TEMIS) NO2 column density Van der A et al., 2006 Jan 1996 Dec 2004 Chinese Emissions in the Global Context
Traffic Restrictions in Beijing during the Sino-African Summit: a natural experiment • Sino-African Summit: Nov 4 – 6, 2006 • Purpose of traffic restrictions: to accommodate the meeting; dress-rehearsal for the 2008 Olympics Games • Traffic Restrictions major initiatives • Bans on government vehicles (490,000 vehicles kept in garage) • Increased capacity in public transportation • Road restrictions • call on private drivers • Public News: 30% reduction in on-road vehicles (800,000 out of 3 million)
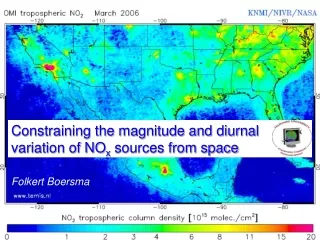
Questions Addressed in this Study: • Can we see the impact on the atmosphere in the near-real-time fashion? 2) How big was the impact using the “top-down” constraints? Is it consistent with the bottom-up estimate? The immediate, global, monitoring capability of NO2 made available through www.TEMIS.nl
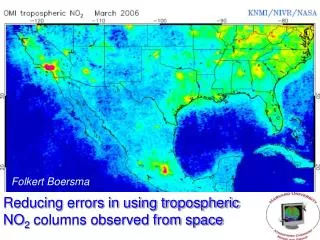
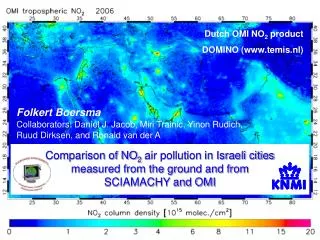
Measuring NO2 from Space SBUV instruments in low Earth orbit GOME OMI 1995-2001 40 x 320 km2 footprint global coverage: 3 days 2004-present 13 x 24 km2footprint global coverage: 1 day near-real-time monitoring of local situations Climatological seasonal variability of NOx sources
Ozone Monitoring Instrument (OMI) • Dutch-Finnish made; aboard NASA EOS Aura satellite • Nadir-viewing instrument measuring direct and atmosphere-backscattered sunlight from 270 – 500 nm (NO2, SO2, O3) • equator crossing time 0145 and 1345: (Beijing crossing time 1-3pm) • Wide field of view (2600 km) global coverage in one day • Small pixel sizes (13 x 24 km2 in the nadir ) • Near-real-time monitoring capability made available through www.temis.nl
Ozone Monitoring Instrument (OMI) • Dutch-Finnish made; aboard NASA EOS Aura satellite • Nadir-viewing instrument measuring direct and atmosphere-backscattered sunlight from 270 – 500 nm (NO2, SO2, O3) • equator crossing time 0145 and 1345: (Beijing crossing time 1-3pm) • Wide field of view (2600 km) global coverage in one day • Small pixel sizes (13 x 24 km2 in the nadir ) • Near-real-time monitoring capability made available through www.temis.nl
Day-to-day Variability in OMI NO2 after Summit Before Summit during Summit Nov. 5 Nov. 7 Oct. 29 • Apparent decrease in NO2 over Beijing during the Summit • Some variations not driven by emission changes • Need a chemical transport model to interpret the OMI observations.
The GEOS-Chem Model • Global chemical transport model; gas and aerosol chemistry • Driven by time-specific, ‘realistic’, assimilated meteorology from NASA GMAO • 2o (lat.) x 2.5o (long.), full representation of the whole troposphere • Extensively tested against measurements (aircraft, surface, and satellite) inside and downwind of China [Wang et al., 2004a; 2004b; Wang et al., 2007a] • Most recent national emission inventory for China [Streets et al., 2006; Zhang et al., 2007]
OMI Observations and Model Comparisons OMI (0.5ox0.5o) OMI (2ox2.5o) model • The model has adequate ability in simulating the variations • The decrease in NO2 over Beijing during the Summit not captured by the model
OMI Observations and Model Comparisons OMI (0.5ox0.5o) model
Consistent temporal variations at two scales Beijing Urban Area (40km x 40km) OMI NO2 (0.5ox0.5o) OMI NO2 (2ox2.5o) Model Scale (2ox2.5o)
Model reproduces spatial patterns NO2 / NOx ratio NOx emis NO2 column
40% reduction ! OMI-Derived Changes in Emissions
Summary • Successful detection of reductions in NOx from space • GEOS-Chem model is able to reproduce day-to-day variations in NO2 columns (when without dramatic changes in emissions) • Vehicular emissions in Beijing • Bottom-up method suggests 70% of total NOx sources • Our results: 40% reduction in total NOx 50% reduction in vehicular sources • Need to be tested by detailed energy consumption data (i.e., gasoline sales) • Traffic restrictions were very effective in reducing emissions of NOx in urban areas of Beijing.
The China Project at Harvard University http://chinaproject.harvard.edu/ • Reliable data on emissions (bottom-up method) • A model assimilating meteorological data with a comprehensive treatment of chemistry (GEOS-Chem model and its nested-grid version) • High quality data for key species providing a meaningful test of the model (ground station, aircraft, and satellite) Elements of its Atmospheric Science Program
TEMIS can be made even better… • The OMI data format (currently 0.3 GB for one day worth of data) • Customized on-line plotting capability (user-defined color scale) What have we benefited from TEMIS? • The Near-Real-Time data from OMI • Stratospheric NO2 columns assimilated from the GOME instrument [Wang et al., 2007a] • Easy data access and communication!
Future Directions using TEMIS Products • To obtain more quantitative constraints on emissions of NOx • The 2008 Summer Olympics and anticipated improvement in air quality • Monitoring of SO2 emissions in China (acid rain and sulfate aerosols) using SCIAMACHY and OMI products. • Trans-boundary pollution transport (intra-Asia, Asia – U.S; Europe-Asia)
Acknowledgement • Financial support from the National Science Foundation, USA • Pieternel Levelt and the OMI Science team • Helpful discussions with Shuxiao Wang, Weihua Ge and Chen Dan at Tsinghua University and Qiang Zhang at the Argonne National Lab. 4. The TEMIS project and support