Download
1 / 66
680 likes | 803 Views
Child Neglect. Diane DePanfilis, Ph.D. University of Maryland School of Social Work. Presentation partially supported by Grant Nos. 90CA1497 & 90CA1580 from the U.S. Department of Health and Human Services, Children's Bureau. Why is this important?.

E N D
Child Neglect Diane DePanfilis, Ph.D. University of Maryland School of Social Work Presentation partially supported by Grant Nos. 90CA1497 & 90CA1580 from the U.S. Department of Health and Human Services, Children's Bureau.
Why is this important? • Neglect is more prevalent than other types of child maltreatment. • CPS cases involving neglect may be more likely to recur during and after intervention than other types of maltreatment. • Less attention has been paid to how to work with families to reduce the risk of continued maltreatment.
Agenda • National Perspective • Scope of problem • Definitions of Neglect • Identification of Neglect • Risks and Strengths • Intervention Strategies
National Incidence Study (NIS-3) - 1993 • Nationally representative sample of counties • Collected data in each county from: • CPS Agencies • Community professionals: law enforcement, medical services, education, mental health, day care, other services • Other sources - e.g., private providers
Standards of HarmNIS-3 • Harm standard - a child suffered demonstrable harm as a result of maltreatment by a parent or parent-substitute. • Endangerment standard - includes harm standard children and adds children who were maltreated and were in danger of being harmed.
Incidence - Harm Standard • 1,553,800 maltreated children - 23.1 children per 1,000 • 743,200 abused children - 11.1 children per 1,000 • 879,000 neglected children - 13.1 children per 1,000
Endangerment Incidence • 2,815,600 - 41.9 maltreated children per 1,000 • 1,221,800 - 18.2 abused children per 1,000 • 1,961,300 - 29.2 neglected children per 1,000
Types of Abuse • ALL abuse - 18.2 children per 1,000 • Physical abuse - 9.1 children per 1,000 • Sexual abuse - 4.5 children per 1,000 • Emotional - 7.9 children per 1,000
Types of Neglect • ALL neglect - 29.2 children per 1,000 • Physical neglect - 19.9 per 1,000 • Emotional neglect - 8.7 per 1,000 • Educational - 5.9 children per 1,000
Important NIS-3 Findings • Only 28% of children under the Harm Standard were investigated by CPS. • Only 33% of children under the Endangerment Standard were investigated by CPS. • The number of maltreated children almost doubled between 1986 and 1993 and serious injuries quadrupled.
Types of Substantiated Maltreatment Reports - 1995 NCCANDS, 1997
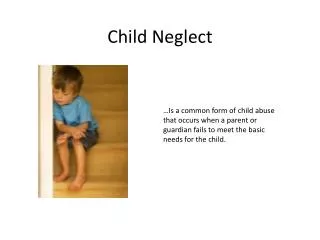
General Definition • (1) Neglect refers to acts of omission of care to meet a child's basic needs that (2) result in harm or a threat of harm to children (DePanfilis, 1996; Dubowitz, Black, Starr, Zuravin, 1993)..
How are children neglected? • inadequate/delayed health care • inadequate nutrition • poor personal hygiene • inadequate clothing • unsafe household conditions • unsanitary household conditions • unstable living conditions
How neglected? (continued) • shuttling • inadequate supervision • inappropriate substitute child care • abandonment • expulsion
How neglected? (continued) • witnessing violence • drug exposed newborn • permitting drug/alcohol use • permitting other maladaptive behavior • inadequate nurturance or affection • isolating • inattention to mental health care needs
How neglected ? (continued) • chronic truancy • failure to enroll/other truancy • unmet special educational needs
How to identify neglect? • Use specific operational definitions • Understand risks and protective factors
What contributes to neglect? • Risk and protective factors interact across four levels: (1) the individual level; (2) the family microsystem; (3) the exosystem; and (4) the social macro system (Belsky, 1980).
NIS-3 FindingsRisks for Child Maltreatment • Family income • Family structure • Family size
NIS-3 Income Related Risks • Compared to families who earned $30,000 per year or more, families who earned below $15,000 per year were: • 22 times more likely to experience child maltreatment • More than 44 times more likely to be neglected • 60 times more likely to die from maltreatment
NIS-3 Family Structure Related Risks • Children in single-parent families had: • 87% greater risk of being harmed by physical neglect and a 165-percent greater risk of experiencing any countable physical neglect • 74% greater risk of being harmed by emotional neglect • 220% greater risk of educational neglect
NIS-3 Family Size Related Risks • Children in the largest families were almost 3 times more likely to be educationally neglected and 2 and 2/5 times more likely to be harmed by physical neglect than children where there were 2 or 3 children and 3 times more likely to be neglected under the endangerment standard than single-child families.
Recurrences by Index Maltreatment Type • 6 studies reported neglect cases with highest rates (Baird, 1988; Berkley Planning, 1983; DePanfilis, 1995; Fryer, 1994; Marks, 1988; Pianta, 1989). • 2 studies reported physical abuse cases with highest rates (Herrenkohl, 1978, Layzer, 1981). • 1 study reported sexual abuse cases with highest rates (Fowler, 1991).
Study of Child Maltreatment Recurrences - Baltimore • Followed 1167 families with substantiated child maltreatment reports in 1988 over 5 years. • Collaborated with Baltimore City Department of Social Services.
Substantiated for physical abuse ONLY 408/35% 34.3% recurrence in 5 years Hazard rate starting at .0011 16% recurrence in Year 1 Substantiated for neglect ONLY 689/59% 49.2% recurrence in 5 years Hazard rate starting at .0027 29% recurrence in Year 1 Comparison between Abuse Only and Neglect Only
Abuse only at index model, strongest predictors: maternal index (mental health & AOD) family stress social support interaction between family stress & social support Neglect only at index model, strongest predictors: child vulnerability partner abuse family stress social support Differences in Predictors?
Abuse recurrence model, strongest predictors: family stress social support Neglect recurrence model , strongest predictor: social support Differences in Predictors?
Child Vulnerability • Every point on a child index increased the hazard rate of recurrence 1.5 times (controlling for other variables in the model). If a family had a child under the age of 6, a child with a mental health problem, and a child with a developmental problem the hazard rate was 4.5 times greater.
Kaplan Meier - Child Index L.R.=19.35, p=.0002
Partner Abuse • The hazard rate was 3.9% higher for families with partner abuse (controlling for other variables in the model).
Family Stress • Every point on a family stress index increased the hazard rate of recurrence 1.5 times (controlling for other variables in the model). The hazard rate was 4.5 times greater for families with more than 2 children, with mothers who gave birth during their teen years, and who bore children over 6 or more years.
Kaplan Meier - Stress Index L.R.=12.05, p=.0170
Social Support Deficits • Every point on a social support deficit index increased the hazard rate of recurrence 1.85 times (controlling for other variables in the model). The hazard rate was 5.6 times greater for families without support from extended family, friends, and other informal systems.
Kaplan Meier - Social Support Deficit Index L.R.=14.72, p=.0021
Risks and Protective Factors - Family Members • Children, caregivers, other adult household members: • Behavior • Emotion • Physical • Cognitive • Social
Risk and Protective Factors -Family • Demographics • Role expectations/satisfaction • Communication • Problem solving • Mutual support • Violence
Risks and Protective Factors - Environment • Social support functions: • emotional support • child related support • financial support • instrumental support • formal support • Adequacy of resources
Environment (continued) • Helpfulness of network: • extended family • friends • formal & informal systems • Housing Conditions • Neighborhood Conditions • Culture
Self report measures • Family Functioning Style Scale • Measures 3 aspects of family functioning style: family identity, information sharing, and coping resource mobilization. • The 12 qualities of strong families comprising the content of these categories are based on an extensive review and integration of the family strengths literature.
Self report measures • Family Needs Scale • identifies the family’s view of their needs or problems. • Family Resource Scale • measures the adequacy of different resources in households with children.
Self report measures • Support Functions Scale • Identifies the degree to which families have people in their lives to meet five social support functions: (1) emotional support; (2) child support items (e.g., cares for child regularly or in emergencies); (3) financial support;(4) instrumental support (e.g., someone to fix things around the house); and (5) agency support (e.g., obtains services for child).
Self report measures • Family Support Scale • Measures the helpfulness of sources of support to families with children. • Personal Network Matrix • Determines the types of help and assistance that are provided to a respondent by different individuals and agencies that make up a person’s personal social network.
Observational Measures • Child Well Being Scales • specific sub-scales • Family Risk Scales • specific sub-scales
Principles for Working with Families to Reduce Risk • Ecological developmental framework • Importance of outreach & community • Family assessment & individualization • Helping alliance with family • Empowerment & strengths based • Cultural competence • Developmentally appropriate • Outcome-based intervention
Intervention Outcomes • Family Maintenance and Safety • Family Member Functioning • Family Functioning • Problem Solving • Social Support • Care of Children
Family Maintenance and Safety • The family demonstrates the ability to meet the basic needs of the family for food, clothing, housing, and health care.
Family Member Functioning- Caregiver • The caregiver demonstrates abilities to achieve self sufficiency, cope with daily stresses, manage emotions, and control impulses.
Family Member Functioning-Children • The children demonstrate developmental appropriateness and or adjustment all areas of functioning.
Family Functioning • The family demonstrates strength in multiple areas such as family-identity, information sharing, coping and resources and uses non-violent methods to resolve family conflict.
Problem Solving • Family members demonstrate abilities and motivation to accurately identify and solve problems.