Download
1 / 32
320 likes | 573 Views
Gene Expression and Evolution. Why are Evolutionists Interested in Gene Expression?. Divergence in gene expression can underlie differences between taxa Gene expression data enable critical tests of several long-standing evolutionary concepts (e.g., tradeoffs)

E N D
Why are Evolutionists Interested in Gene Expression? • Divergence in gene expression can underlie differences between taxa • Gene expression data enable critical tests of several long-standing evolutionary concepts (e.g., tradeoffs) • Gene expression levels are heritable and can be treated as bona fide quantitative traits
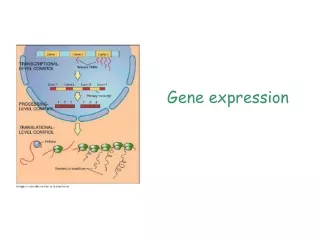
Techniques for Studying Gene Expression • Traditional methods - Western blot (protein level) - Northern blot (mRNA level) - RNase protection assay (mRNA level) • PCR-based - Semi-quantitative RT-PCR (mRNA level) - Quantitative real-time RT-PCR (mRNA level) • Genomic approaches - Proteomics (protein level) - Sequence counting techniques (mRNA level) - Microarrays (mRNA level)
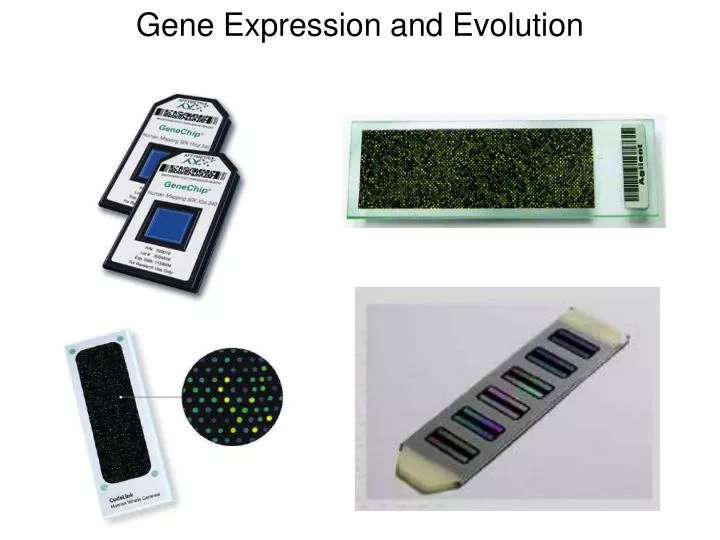
What Is Microarray Technology? High throughput method for simultaneously measuring mRNA abundances for thousands of genes. Thousands of probes or features adhered to a solid substrate at known x,y coordinates.
How Do Microarrays Work? Hybridization Technique - RNA is isolated from a cell line or tissue of interest, processed, labeled, and hybridized to probes. - Label intensity at a given location on the substrate correlates with the amount of a particular transcript expressed in the cell line or tissue
Array Fabrication • Many methods… a detailed discussion is beyond the scope of this lecture • Array fabrication always involves using robotic work stations to adhere the appropriate nucleotide sequences to a substrate… The length of the sequences, spatial arrangement of sequences on the grid, and nature of the substrate all vary • Well designed arrays give multiple estimates for a given gene and spread these estimates across the substrate
Array Processing • Hybridize processed and labeled RNA samples to the array - Denature - Put in conditions that promote hybridization - Wash • Scan arrays with laser (Excite/Detect label) • Image processing and spot quantification
Background • Basic problem is that even after performing washes…there will be unevenness across the substrate in the amount of non-specific label • Background correcting seeks to make intensities from any two parts of the array comparable by estimating and accounting for this unevenness
Normalization • Even after background correcting… Comparisons still must be made between arrays… • Normalization seeks to remove variation between arrays that is due to technical sources (e.g., scanning, batch effects, etc.)
Creating an “Expression Measure” • Well designed arrays have multiple features interrogating a given transcript • This dilutes the contribution of aberrant spots and is likely to result in more accurate estimates of gene expression • These values must be summarized into an “expression measure” • Some strategies down-weight values that are further from the mean
Biological (1) Experimental Treatments (2) Individual variation... may or may not be good (3) Nonspecific hybridization (e.g., paralogs of gene families) Technical (Bad) (1) RNA quality (2) Dye biases (3) Stochasticity during scanning, image processing (5) Errors during probe synthesis or deposition (6) Stochasticity in labeling targets Sources of Variation in Microarray Experiments
Designing Experiments • The goal of most array experiments is to compare RNA abundances between groups of interest (e.g., across populations, environmental conditions, or developmental stages) • Like all exercises in experimental biology… this involves careful consideration of: - How to remove extraneous sources of variation - How to collect and analyze the data
Identifying Interesting Genes • How can one objectively state that transcript levels for a given gene differ among the groups of interest? • Statistics! - Allows one to attach a numerical value to the likelihood that gene expression among groups is the same - Ultimately, one describes differential expression in terms of probabilities • Examples of Statistical Tests (t-test, ANOVA, linear regression)
The Burden of Multiple Testing A given microarray may have over 40,000 probes!!! This means that one may run > 40,000 statistical tests. If α = 0.05, then 1 out of every 20 genes identified via statistical tests is expected to be due to chance alone. If one runs 40,000 tests, then by chance alone he/she will reject ~ 40,000 x 0.05 = 2000 true null hypotheses (i.e., he/she will have ~ 2000 false positives)
Gene Ontology & Biological Categorization • Microarray datasets can be intimidating because they contain A LOT of information • Even experts on a system can be overwhelmed by the number of genes that are differentially regulated in some experiments • Having a standardized nomenclature that places a gene into one or more biological contexts can be invaluable when one is trying to make sense out of data on thousands of genes Gene Ontology is a standardized hierarchical nomenclature that classifies genes under three broad categories
Visualization, Categorization, & Multivariate Statistics Clustering Principal Component Analysis
Classification Discriminant Analysis Machine Learning From PNAS 102(21)
Transcriptional Networks & Graph Theory From Nature Genetics 41(5)
Comparisons Across Taxa • Comparisons are often made between closely related taxa using array technology • Such comparisons can yield fascinating insights into gene expression differences between species • However, sequence divergence between species in the gene regions targeted by microarray probes can be a major hurdle to data interpretation
Heterologous Hybridization • Hybridizing RNA isolated from one species to an array whose probes were designed from another species • Major concern is cross (i.e., non-specific) hybridization and poor hybridization due to sequence mismatch… Reduces correlation between signal and transcript abundance • Care must be taken to identify conserved features on the array
eQTLs & Genetical Genomics From Skelly et al. 2009
Conclusions of eQTL Studies • Transcriptional variation is often heritable • Heritable transcriptional variation is frequently polygenic and often has a complex genetic architecture
Terrestrial Adult Eastern Tiger Salamander Aquatic Adult Paedomorphosis Mexican Axolotl Examples From the Voss Lab Metamorphosis Egg Aquatic Larva
Parental Species: Growth Axolotl Tiger R2 = 0.957
Mexican Axolotl vs. Eastern Tiger Salamander • Whole brain from axolotl and eastern tiger salamander • Sampled at 2 week intervals (42, 56, 70, 84 DPH) • Three replicate chips per species per time point • Three animals (brains) per chip
Parental Species: Gene Expression in the Brain Axolotl Tiger
NGFRm/m NGFRm/t From Voss and Smith 2005
Backcross: Growth NGFRm/m NGFRm/t R2 = 0.972
Backcross: Gene Expression in the Brain NGFRm/m NGFRm/t