Download
1 / 27
270 likes | 357 Views
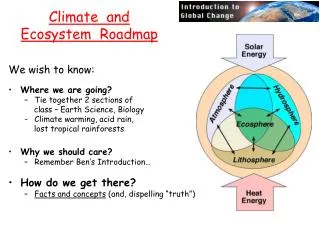
Mining Climate and Ecosystem Data. Team Motivation Transformative Computer Science Research Predictive Modeling Complex Networks Association Analysis High Performance Computing Evaluation Plan Relationship to Physics Based Models Management and Collaboration. Team.

E N D
Mining Climate and Ecosystem Data • Team • Motivation • Transformative Computer Science Research • Predictive Modeling • Complex Networks • Association Analysis • High Performance Computing • Evaluation Plan • Relationship to Physics Based Models • Management and Collaboration
Team Vipin Kumar, UM AuroopGanguly, UTK/ORNL NagizaSamatova, NCSU ArindamBanerjee, UM Fred Semazzi, NCSU Joe Knight, UM ShashiShekhar, UM Peter Snyder, UM Jon Foley, UM Alok Choudhary, NW AbdollahHomiafar, NCA&T Michael Steinbach, UM SingdhansuChatterjee, UM
Team Qualifications Team members are well-recognized experts in Analysis of ecosystem and climate data • Foley, Ganguly, Kumar, Semazzi, Snyder, Steinbach Data mining, machine learning, nonlinear dynamics & signal processing • Banerjee, Chatterjee, Choudhary, Ganguly, Homaifar, Kumar, Samatova, Shekhar, Steinbach High performance computing • Choudhary, Kumar, Samatova Weather and climate models • Ganguly, Foley, Semazzi, Snyder Remote sensing and land cover change • Foley, Knight, Snyder
Climate Change: The defining issue of our era • The planet is warming • Multiple lines of evidence • Credible link to human GHG (green house gas) emissions • Consequences can be dire • Extreme weather events • Regional climate and ecosystem shifts • Abrupt climate change • Stress on key resources and critical infrastructures • There is an urgency to act • Adaptation: “Manage the unavoidabale” • Mitigation: “Avoid the unmanageable” • The societal cost of both action and inaction is large Anomalies from 1880-1919 (K) Figure Courtesy: ORNL Key outstanding science challenge:Actionable predictive insights to credibly inform policy
Physics-based Models are Essential but Not Adequate • Models make relatively reliable predictions at global scale for ancillary variables: • Sea Surface Temperature (SST) • Temperature/humidity profiles over land • Wind spread at different heights • They provide least reliable predictions for variables that are crucial for impact assessment: • Regional precipitation and extremes • Hurricane intensity and frequency • Droughts and floods Hypothesis-driven “manual” conceptual models try to address this gap: • Hurricane models (Emanuel et al, BAMS, 2008) • Regional-scale precipitation extremes (O’Gorman & Schneider, PNAS, 2008; Sugiyama et al, PNAS, 2010) Disagreement between IPCC models “The sad truth of climate science is that the most crucial information is the least reliable” (Nature, 2010) Regional hydrology (“P–E” changes in 2030s) exhibits large variations among major IPCC model projections We need a systematic approach to semi-automatic data-driven model inference.
Data-Driven Knowledge Discovery in Climate Science • From data-poor to data-rich transformation • Sensor Observations: Remote sensors like satellites and weather radars as well as in-situ sensors and sensor networks like weather station and radiation measurements • Model Simulations: IPCC climate or earth system models as well as regional models of climate and hydrology, along with observed data based model reconstructions • Data-guided insights can complement physics-based models • Transform global ancillary information to regional critical climate changes and extremes • Assess reliability of model projections and inform physics model parameterizations • Validate predictions with both held-out data and science understanding • Provide relatively hypothesis-free discovery processes to supplement hypothesis-guided data analysis "The world of science has changed ... data-intensive science [is] so different that it is worth distinguishing [it] … as a new, fourth paradigm for scientific exploration." - Jim Gray
Challenges in Analyzing Eco-Climate Data Global Sea Surface Temperature
Challenges in Analyzing Eco-Climate Data Global Sea Surface Temperature Discovering teleconnections El Nino Events Nino 1+2 Index
Challenges in Analyzing Eco-Climate Data Global Sea Surface Temperature Discovering teleconnections El Nino Events Nino 1+2 Index
Challenges in Analyzing Eco-Climate Data Global Sea Surface Temperature Discovering teleconnections El Nino Events Nino 1+2 Index Changes in Global Forest Cover
Challenges in Analyzing Eco-Climate Data Global Sea Surface Temperature Discovering teleconnections El Nino Events Nino 1+2 Index Relationship between El Nino and Fires in Indonesia Changes in Global Forest Cover
Challenges in Analyzing Eco-Climate Data Global Sea Surface Temperature Discovering teleconnections Challenges due to data characteristics • Spatiotemporal, non-stationary, non-i.i.d. • Nonlinear multiscale dependencies • Low frequency variability • Massive data sets • Long range spatial dependencies • Long memory temporal dependencies • … El Nino Events Nino 1+2 Index Relationship between El Nino and Fires in Indonesia Changes in Global Forest Cover
Transformative Computer Science Research Enabling large-scale data-driven science for complex, multivariate, spatio-temporal, non-linear, and dynamic systems: • Fusion plasma • Combustion • Astrophysics • …. Complex Networks Enable studying of collective behavior of interacting eco-climate systems The Expedition is an end-to-end demonstration of this major paradigm for future knowledge discovery process. Nonlinear, space-time lag, geographical, multi-scale Predictive Modeling Enable predictive modeling of typical and extreme behavior from multivariate spatio-temporal data Relationship Mining Enable discovery of complex dependence structures such as non linear associations or long range spatial dependencies relationships Community structure- function-dynamics kernels , features, dependencies Nonlinear, spatio-temporal, multivariate Nonlinear, spatio-temporal, multi-variate, persistence, long memory High Performance Computing Enable efficient large-scale spatio-temporal analytics on future generation exascale HPC platforms with complex memory hierarchies Large scale, spatio-temporal, unstructured, dynamic
Objective To develop methods for discovery of complex dependence structures (e.g., nonlinear associations, long-range spatial dependencies) Relationship Mining Dynamic behavior of the high and low pressure fields corresponding to NOA climate index (Portis et al, 2001) Computer Science Innovations • Define a notion of “transactions” for association analysis in spatio-temporal data • Adapt association analysis to continuous data • Reduce the number of redundant patterns and assess statistical significance of the identified patterns • Define a new approach to association analysis that trades off completeness for a smaller, simpler set of patterns and far smaller computational requirements Impact • Facilitate discovery of complex dependence structures in dynamic systems • Understand relationships between fire size and frequency to precipitation, land cover, ocean temperature, etc • Characterize impacts of sea surface temperature on hurricane frequency and intensity • Understand feedback effects, the key uncertainty in climate science
Complex Networks Objectives • To develop algorithms for characterization of network structure, function, and dynamics • To enable large-scale comparative analysis of climate networks to increase prediction confidence • Node degree in a correlation-based climate network Computer Science Innovations • Construct multivariate networks to capture nonlinear spatio-temporal interactions • Characterize network dynamics at multiple spatial scales over different time periods • Scale graph mining algorithms to the required size and number for comparative analysis of multiple real-world networks Impact • Apply network structure-function-dynamics methods to complex systems • Understand intricate interplay between topology and dynamics of the climate system over many spatial scales • Explain the 20th century great climate shifts from the collective behavior of interacting subsystems
To advance nonparametric multivariate spatio-temporal probabilistic regression models to incorporate nonlinear dependencies To develop latent variable models to characterize spatio-temporal climate states To advance multivariate extreme value theory through geometric and probabilistic generalizations of quantiles Alok Choudhary, NWU Nagiza Samatova, NCSU Vipin Kumar, UMN Predictive Modeling Objectives Correlated Gaussian Processes for multivariate spatiotemporal regression w/ nonlinear dependencies + = Multivariate quantiles for extreme value analysis Impact Computer Science Innovations GP1 GP2 • Uncertainty quantified predictions of climate variables, e.g., precipitation, over space-time • Abrupt climate change detection, typical climate characterization • Modeling regional climate change and extreme climate events, e.g., hurricanes • Applications beyond climate data, e.g., finance, healthcare, bioinformatics, networks • Take into account nonlinear spatial, temporal, and multivariate dependencies • Minimize assumptions on temporal evolution, e.g., no`Markov’ assumptions • Deal with curse of dimensionality in nonlinear extreme value analysis (recency, frequency, duration) and quantiles • Scale algorithms yet ensure uncertainty quantification
High Performance Computing Objectives • To investigate a “co-design” approach to scalable analysis of complex dependence structures • To develop parallel and scalable statistical and data mining functions and kernels • To develop sophisticated parallel I/O techniques that fully exploit complex memory hierarchy (disks, SSDs, DRAMs, accelerators) An architecture with accelerators such as GPUs. Some/all nodes have accelerators and many cores. Computer Science Innovations • The first“co-design” approach that will take into account exploration of nonlinear associations, long-range spatial dependencies, I/O requirements and optimizations, presence of accelerators and multiple suitable programming models for HPC systems • Novel optimizations to deal with data-and-compute intensive computations on exascale platforms with complex memory hierarchies Impact • Analytical kernels that will scale many data mining algorithms • Analytics algorithms designed for effective exploration of complex spatio-temporal dependence structures
Synergy with Physical Modeling Community CS and Climate Science Synergies Physics based models inform data mining More credible variables (e.g., SST) more crucial variables (e.g., precipitations/hurricanes) Better modeled processes (e.g., atmospheric physics) more crucial processes (e.g., land surface hydrology) Global and century scale regional and decadal scale Data mining informs physics based models Better understanding of climate processes Improved insights for parametrization schemes Prominent climate science expertise on the team Foley, Ganguly, Semazzi, and Snyder Collaborators: Potter (NASA), Erickson (ORNL) Active involvement in the IPCC assessment reports Strong Ties w/ Climate Community • Partnership with ORNL, NCAR, LLNL, LBL climate modeling and simulated data archival groups: • Community Climate System Model (NCAR, ORNL, LBL), Earth Systems Grid, IPCC data archives (PCMDI at LLNL and HPSS at ORNL), Climate data analysis and extremes (ORNL, LBL) • Partnership with NASA, ORNL, NOAA observed and reanalysis data archival and analysis groups: • Remote sensed satellite and other data (NASA), in situ sensors like DOE's ARM (ORNL, PNNL), Reanalysis and observed data assimilation (NOAA)
Measures of Success in CS Research Does the proposed research enable significantly better data analysis than before or enable new kinds of analysis? • Predictive Modeling • Improved capabilities for multivariate spatio-temporal regression that can simultaneously capture the dependencies between spatial-temporal objects (e.g., temperature, pressure) and help find novel climate patterns not found by standard approaches • New capabilities for detecting extreme events using quantiles and quantile regression for multivariate data • Complex Networks • Detection of known climate patterns and tracking of the evolution of climate patterns in time using complex networks that capture non-linear relationships in multivariate and multiscale data • Relationship Mining • Creation of entirely new capabilities in association mining from approaches that extend / modify traditional approaches to handle spatio-temporal data • Creation of a completely novel approach for association analysis that reduces the number of patterns and the time required to find them • Improvement in the performance of complex networks and predictive models by using nonlinear relationships that more faithfully represent reality • High Performance Computing • Scalable analytics code for spatio-temporal data • Enabling of large scale data driven science that serves as a demonstration of the value of the data driven paradigm
Climate-based Measures of Success • Ultimate success is to have data-driven analysis included as a standard part of climate projections and impact assessment (e.g., for IPCC). • Achieving this will require measuring and demonstrating success in two key areas • Filling critical gaps in climate science (Nature, 2010) • Reduction of uncertainty in climate predictions at regional and decadal scales • Improved predictive insights for key precipitation processes • Providing credible assessments of extreme hydro-meteorological events • New knowledge about climate processes (e.g., teleconnection patterns) • Improve climate change impact assessments and inform policy • Distinguishing between natural and anthropogenic causes • Improved assessments of climate change risks across multiple sectors • Specific use cases will provide the context for these evaluations
Science Impact View: Evaluation Methodology • Can we improve the projection (e.g., hurricane frequency, intensity)? • Can the data-driven model identify: • which regional climate variables are informative/causal (e.g., SST, wind speed)? • what is the relationship (+/- feedback) between these variables? • To what extent does the data-driven model inform climate scientists? Forecast & Compare w/ Observation Data 1950 2010 (now) 2100 1870 Train Model Forecast & Multi-model Comparison Hindcast Prediction • Reanalysis data • Observed data • Model projection data • Observed data Illustrative Example for Hurricane Frequency Use Case
CS Technologies Co-design-based scalable analytics of complex dependence structures Yr5+ Yr5 Nonparametric multivariate spatio-temporal probabilistic regression models Identify drought and pluvial event triggers to improve prediction Understand and quantify the uncertainty of feedback effects in climate Yr4 Project climate extremes at regional and decadal scales Multivariate extreme value theory based on geom./prob. quantiles Yr3 Understand relationships between fire size and frequency to precipitation, land cover, ocean temperature, etc. Association analysis-based interplay between complex dependence structures Yr2 Yr1 Characterize impacts of sea surface temperature on hurricane frequency and intensity Networks for multivariate nonlinear space-time interactions Long-memory, long-range, multiscale Heterogeneous Multivariate Non-linear Non-stationary non-i.i.d Conceptual View: Driving Use-Cases Characterize feedbacks contributing to abrupt climate regime changes Data Challenges
Year 5-5+ Year 1-2 Year 3-4 Extreme value theory based on geom./prob. quantiles Uncertainty quantification in single regime-shift detection Attribution in multi- regime-shifts Multivariate spatio-temporal regression, Climate state estimation Multivariate network construction Handling nonlinear spatio-temporal interactions Dynamic community detection & tracking Graph perturbation theory for “what-if” exploration A notion of “transactions” in spatio-temporal data Scalable parallel analysis kernels Impact of SST on hurricane intensity & frequency Data driven analysis as a standard (e.g. in IPCC) Identify drought and pluvial event triggers to improve prediction Community software, benchmarks outreach CS Technology View: Deliverables Roadmap Comparative multiple network analysis Statistical significance assessment of relationships Detection of nonlinear associations/relationships Adapt association analysis to continuous data Parallel I/O techniques to exploit memory hierarchy Co-design scalable complex dependence structures
Use Case: Hurricane Frequency Steps for Discovery of Multivariate Non-linear Interactions Yr1.5: NCSU, UMN, NWU Yr1: UTK/ORNL, UMN, NWU IPCC AR4 Models: CMIP3 datasets Monthly mean sea surface temperature Monthly mean atmospheric temperature Daily horizontal wind at 250/850 hPa 2. Construct multivariate nonlinear climate network 3. Detect & track communities 1. Pre-process ancillary climate model outputs Steps for Predictive Modeling of Hurricanes Yr1.5: UMN, UTK/ORNL Yr2: UMN, UTK/ORNL Yr2.5: UMN, UTK/ORNL SST impact on hurricane frequency & intensity 5. Determine non-stationary non-i.i.d. climates states & Build hurricane models 4. Validate w/ hindcasts 3. Find non-linear relationships
Use Case: Regional Precipitation Step1: Conceptual physics models (O’Gorman and Schneider 2009) and relationship mining identify variables in 3D (space, time, vertical) neighborhoods with information relevant for predicting precipitation Step 2: Precipitation mean and extremes are projected with ancillary variables in 3D neighborhoods with predictive modeling Step 3: Complex networks are constructed over oceans using relationship mining Step 4: Complex networks develop proxies for global and regional scale ocean dynamics leading to set of potential predictors Step 7: Regional precipitation prediction gains are run through cross-validation and interpreted with climate science Step 6: The (Step 2) 3D neighborhood-based predictions are combined with teleconnction-based predictions with fusion of predictive modeling Step 5: Teleconnections are developed to predict regional precipitation change and their extremes based on both relationship mining and predictive modeling
Use Case: 1930s Dust Bowl 1930s Dust Bowl Drought Affected almost two-thirds of the U.S. Centered over the agriculturally productive Great Plains Drought initiated by anomalous tropical SSTs (Teleconnections) NASA NSIPP Model: 14 C20C datasets Ensemble of 14 100-year simulations of the 20th Century Forced with observed monthly SSTs Allows for assessment of how much the SSTs control Great Plains climate variations Information content in C20C model simulations along with ancillary observations can be used to identify and predict drought “triggers” and the contribution of complex feedbacks to abrupt precipitation regime changes and drought persistence However, the abrupt change in the precipitation regime and decade-long persistence of drought thought to be related to strong land-atmosphere feedbacks (e.g., precipitation recycling) Global SST anomalies averaged over 1932-1938. Boxes represent sub-regions used to identify the relative importance of SST anomalies in initiating the the Dust Bowl drought. Time series of precipitation anomalies averaged over the Great Plains region for 14 ensemble members of C20C run. Anomalous Tropical SSTs explain most of the 20th Century drought events. From Schubert et al. (2004)
Use Case: Regime Shift in Sahara & Sahel Regime Shift in Sahara Sudden shift from `Green Sahara’ to `Desert Sahara’ Sahara consisted of extensive vegetation, lakes, wetlands according to Geologic data. Sudden transition from vegetated to desert conditions around 5500 years ago Complex system with more than one stable state. Precipitation patterns are tightly correlated with vegetation cover patterns. Northern Africa is dominated by the Sahara. The transition between the Sahara and the savanna/tropical forest to the south occurs in the Sahel. Vegetation cover and precipitation patterns Sahel zone • Key Questions stay unanswered: • - What were underlying conditions? • - What triggered the regime shift? Regime Shift in Sahel Sahel is the transition zone between the Sahara to the north and the tropical savanna and evergreen forests to the south Onset of major 30-year drought over the Sahel region in 1969 Sahel drought led to widespread famine, ecosystem degradation, and dispersion of its inhabitants Data analysis for hypothesis generation, testing: Reduction in Precipitation + Such sudden, large change in environmental–or “regime shift”—often occurs without advance warning. Underlying conditions may predispose a system to a regime shift. A fairly small event, e.g., storm, drought, etc., may trigger the shift to a new stable state. Reduction in Vegetation Possible hypothesis: Land-atmosphere feedback process